Plot
? |
Symb
? |
Source
* |
Average ? |
Thresholds ? |
N_
data |
QC1
parameter |
Data
downloads |
Remarks |
| method |
value |
unit |
method |
value |
| 1 |
• | QC1DB |
none |
|
NONE |
none | |
13 |
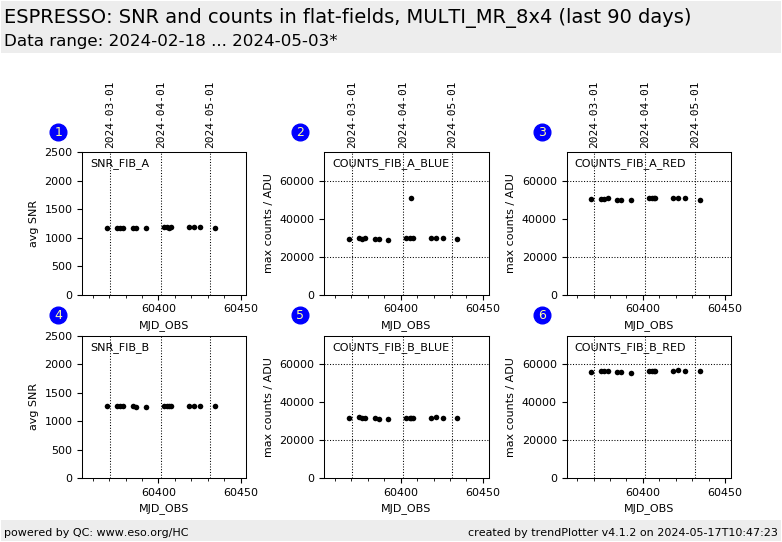
fiba_snr_avg |
this |
last_yr |
all
|
SNR, average per order, fibre A |
| 2 |
• | QC1DB |
none |
|
ADU |
VAL | 20000,60000 |
13 |
fiba_counts_max_blue |
this |
last_yr |
all
|
maximum number of counts on BLUE detector, fibre A |
| 3 |
• | QC1DB |
none |
|
ADU |
VAL | 20000,60000 |
13 |
fiba_counts_max_red |
this |
last_yr |
all
|
maximum number of counts on RED detector, fibre A |
| 4 |
• | QC1DB |
none |
|
NONE |
none | |
13 |
fibb_snr_avg |
this |
last_yr |
all
|
SNR, average per order, fibre B |
| 5 |
• | QC1DB |
none |
|
ADU |
VAL | 20000,60000 |
13 |
fibb_counts_max_blue |
this |
last_yr |
all
|
maximum number of counts on BLUE detector, fibre B |
| 6 |
• | QC1DB |
none |
|
ADU |
VAL | 20000,60000 |
13 |
fibb_counts_max_red |
this |
last_yr |
all
|
maximum number of counts on RED detector, fibre B |
| |
|
*Data sources: QC1DB: QC1 database; LOCAL: local data source
|
Plot 1
scores: not implemented
| | data source: | espresso_flat
(QC1 database) |
| dataset: | fiba_snr_avg | • |
| average: | none |
| thresholds: | none |
| N_data plotted: | 13 |
| [click plot for closeup] |
Plot 2
scores:  2| 2|
| | data source: | espresso_flat
(QC1 database) |
| dataset: | fiba_counts_max_blue | • |
| average: | none |
| fixed thresholds: | 20000...60000 | ADU |
| N_data plotted: | 13 |
| [click plot for closeup] |
Plot 3
scores: 2|
| | data source: | espresso_flat
(QC1 database) |
| dataset: | fiba_counts_max_red | • |
| average: | none |
| fixed thresholds: | 20000...60000 | ADU |
| N_data plotted: | 13 |
| [click plot for closeup] |
Plot 4
scores: not implemented
| | data source: | espresso_flat
(QC1 database) |
| dataset: | fibb_snr_avg | • |
| average: | none |
| thresholds: | none |
| N_data plotted: | 13 |
| [click plot for closeup] |
Plot 5
scores: 2|
| | data source: | espresso_flat
(QC1 database) |
| dataset: | fibb_counts_max_blue | • |
| average: | none |
| fixed thresholds: | 20000...60000 | ADU |
| N_data plotted: | 13 |
| [click plot for closeup] |
Plot 6
scores: 2|
| | data source: | espresso_flat
(QC1 database) |
| dataset: | fibb_counts_max_red | • |
| average: | none |
| fixed thresholds: | 20000...60000 | ADU |
| N_data plotted: | 13 |
| [click plot for closeup] |
Trending plots for flat-field calibrations. The plot show the
minimum signal-to-noise ratio (SNR) that is achieved per spectroscopic order
and the maximum number of counts per detector. Counts are converted from ADU
into electrons. The plots come separately for fibre A and B.
The upper limit for the counts has been set slightly below the saturation limit of 65535 ADU,
converted into electrons.
General information
Click on any of the plots to see a close-up version.
The latest date is indicated on top of the plot.
If configured,
- data points belonging to the latest date are specially marked
- statistical averages are indicated by a solid line, and thresholds by broken lines
- outliers are marked by a red asterisk. They are defined as data points outside the
threshold lines
- "aliens" (= data points outside the plot Y limits) are marked by a red arrow (↑ or ↓)
- you can download the data for each parameter set if the 'Data downloads' link shows up
|
