|
|
| MATISSE trending system: HEALTH CHECK report |
|
|
| Last update: 2026-07-14T12:22:13 (UT)
|
|
|
|
|
| General news: |
NOTE: The Health Check and calChecker services have been moved to qcFlow. These pages are only maintained for comparison
and will be removed in 2026.
|
|
MATISSE news:
|
|
Report news:

|
|
|
|
|
|
|

|
|
|
Plot
? |
Symb
? |
Source
* |
Average ? |
Thresholds ? |
N_
data |
QC1
parameter |
Data
downloads |
Remarks |
| method |
value |
unit |
method |
value |
| 1 |
• | QC1DB |
none |
|
px |
none | |
30 |
flux_kappa_p1 |
this |
last_yr |
all
|
HAWAII-R2G (MATISSE-LM) - LOW - flux Phot1 |
| 1 |
• | QC1DB |
none |
|
px |
none | |
30 |
flux_kappa_p2 |
this |
last_yr |
all
|
LM - LOW - flux Phot2 |
| 1 |
• | QC1DB |
none |
|
px |
none | |
30 |
flux_kappa_p3 |
this |
last_yr |
all
|
LM - LOW - flux Phot3 |
| 1 |
• | QC1DB |
none |
|
px |
none | |
30 |
flux_kappa_p4 |
this |
last_yr |
all
|
LM - LOW - flux Phot4 |
| 2 |
• | QC1DB |
none |
|
px |
none | |
17 |
flux_kappa_p1 |
this |
last_yr |
all
|
LM- MED - flux Phot1 |
| 2 |
• | QC1DB |
none |
|
px |
none | |
17 |
flux_kappa_p2 |
this |
last_yr |
all
|
LM - MED - flux Phot2 |
| 2 |
• | QC1DB |
none |
|
px |
none | |
17 |
flux_kappa_p3 |
this |
last_yr |
all
|
LM - MED - flux Phot3 |
| 2 |
• | QC1DB |
none |
|
px |
none | |
17 |
flux_kappa_p4 |
this |
last_yr |
all
|
LM - MED - flux Phot4 |
| 3 |
• | QC1DB |
none |
|
px |
none | |
16 |
flux_kappa_p1 |
this |
last_yr |
all
|
L - HIGH - flux Phot1 |
| 3 |
• | QC1DB |
none |
|
px |
none | |
16 |
flux_kappa_p2 |
this |
last_yr |
all
|
L - HIGH - flux Phot2 |
| 3 |
• | QC1DB |
none |
|
px |
none | |
16 |
flux_kappa_p3 |
this |
last_yr |
all
|
L - HIGH - flux Phot3 |
| 3 |
• | QC1DB |
none |
|
px |
none | |
16 |
flux_kappa_p4 |
this |
last_yr |
all
|
L - HIGH - flux Phot4 |
| 4 |
• | QC1DB |
none |
|
px |
none | |
16 |
flux_kappa_p1 |
this |
last_yr |
all
|
L - HIGHP - flux Phot1 |
| 4 |
• | QC1DB |
none |
|
px |
none | |
16 |
flux_kappa_p2 |
this |
last_yr |
all
|
L - HIGHP - flux Phot2 |
| 4 |
• | QC1DB |
none |
|
px |
none | |
16 |
flux_kappa_p3 |
this |
last_yr |
all
|
L - HIGHP - flux Phot3 |
| 4 |
• | QC1DB |
none |
|
px |
none | |
16 |
flux_kappa_p4 |
this |
last_yr |
all
|
L - HIGHP - flux Phot4 |
| 5 |
• | QC1DB |
none |
|
px |
none | |
17 |
flux_kappa_p1 |
this |
last_yr |
all
|
M - HIGHP - flux Phot1 |
| 5 |
• | QC1DB |
none |
|
px |
none | |
17 |
flux_kappa_p2 |
this |
last_yr |
all
|
M - HIGHP - flux Phot2 |
| 5 |
• | QC1DB |
none |
|
px |
none | |
17 |
flux_kappa_p3 |
this |
last_yr |
all
|
M - HIGHP - flux Phot3 |
| 5 |
• | QC1DB |
none |
|
px |
none | |
17 |
flux_kappa_p4 |
this |
last_yr |
all
|
M - HIGHP - flux Phot4 |
| |
|
*Data sources: QC1DB: QC1 database; LOCAL: local data source
|
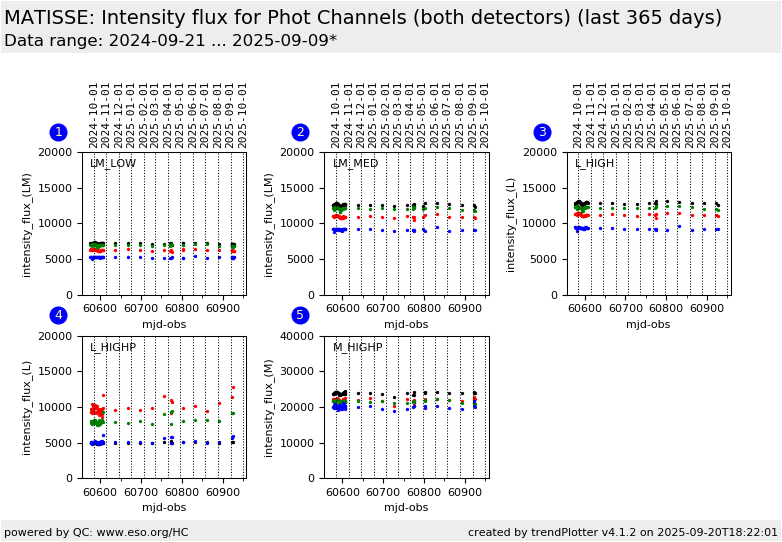
Plot 1
scores: not implemented
| | data source: | matisse_kappamatrix
(QC1 database) |
dataset:
(numbers below apply to this dataset) | flux_kappa_p1 | • |
| average: | none |
| thresholds: | none |
| N_data plotted: | 30 |
| [click plot for closeup] |
Plot 2
scores: not implemented
| | data source: | matisse_kappamatrix
(QC1 database) |
dataset:
(numbers below apply to this dataset) | flux_kappa_p1 | • |
| average: | none |
| thresholds: | none |
| N_data plotted: | 17 |
| [click plot for closeup] |
Plot 3
scores: not implemented
| | data source: | matisse_kappamatrix
(QC1 database) |
dataset:
(numbers below apply to this dataset) | flux_kappa_p1 | • |
| average: | none |
| thresholds: | none |
| N_data plotted: | 16 |
| [click plot for closeup] |
Plot 4
scores: not implemented
| | data source: | matisse_kappamatrix
(QC1 database) |
dataset:
(numbers below apply to this dataset) | flux_kappa_p1 | • |
| average: | none |
| thresholds: | none |
| N_data plotted: | 16 |
| [click plot for closeup] |
Plot 5
scores: not implemented
| | data source: | matisse_kappamatrix
(QC1 database) |
dataset:
(numbers below apply to this dataset) | flux_kappa_p1 | • |
| average: | none |
| thresholds: | none |
| N_data plotted: | 17 |
| [click plot for closeup] |
Click on any of the plots to see a close-up version.
The latest date is indicated on top of the plot.
If configured,
- data points belonging to the latest date are specially marked
- statistical averages are indicated by a solid line, and thresholds by broken lines
- outliers are marked by a red asterisk. They are defined as data points outside the
threshold lines
- "aliens" (= data points outside the plot Y limits) are marked by a red arrow (↑ or ↓)
- you can download the data for each parameter set if the 'Data downloads' link shows up
|
|