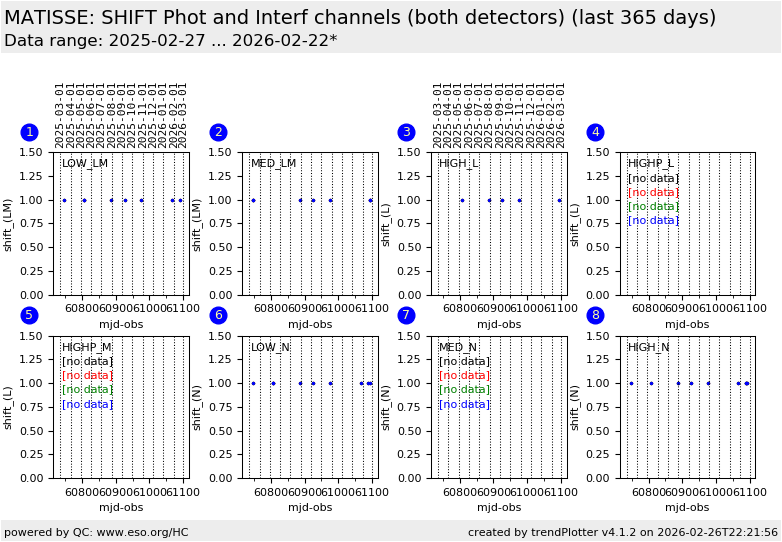
MATISSE trending system: HEALTH CHECK report
Last update: 2026-02-20T12:22:52 (UT)
[enable javascript for displaying time difference!]
General news:
NOTE: The Health Check and calChecker services are moved to qcFlow on an instrument by instrument basis. The current pages will not be updated any longer once the move has been finished.
MATISSE news:
Report news:
Plot? Symb? Source Average ? Thresholds ? N_ QC1 Data Remarks
method value unit method value
1
• QC1DB none px none 8 cov_shift_intphot1
this |
last_yr |
all
HAWAII-R2G (MATISSE-LM) - LOW - Shift Phot1
1
• QC1DB none px none 8 cov_shift_intphot2
this |
last_yr |
all
LM - LOW - Shift Phot2
1
• QC1DB none px none 8 cov_shift_intphot3
this |
last_yr |
all
LM - LOW - Shift Phot3
1
• QC1DB none px none 8 cov_shift_intphot4
this |
last_yr |
all
LM - LOW - Shift Phot4
2
• QC1DB none px none 5 cov_shift_intphot1
this |
last_yr |
all
LM- MED - Shift Phot1
2
• QC1DB none px none 5 cov_shift_intphot2
this |
last_yr |
all
LM - MED - Shift Phot2
2
• QC1DB none px none 5 cov_shift_intphot3
this |
last_yr |
all
LM - MED - Shift Phot3
2
• QC1DB none px none 5 cov_shift_intphot4
this |
last_yr |
all
LM - MED - Shift Phot4
3
• QC1DB none px none 4 cov_shift_intphot1
this |
last_yr |
all
L - HIGH - Shift Phot1
3
• QC1DB none px none 4 cov_shift_intphot2
this |
last_yr |
all
L - HIGH - Shift Phot2
3
• QC1DB none px none 4 cov_shift_intphot3
this |
last_yr |
all
LM - HIGH - Shift Phot3
3
• QC1DB none px none 4 cov_shift_intphot4
this |
last_yr |
all
LM - LOW - Shift Phot4
4
• QC1DB none px none 0 cov_shift_intphot4
this |
last_yr |
all
L - HIGHP - Shift Phot4
4
• QC1DB none px none 0 cov_shift_intphot4
this |
last_yr |
all
L - HIGHP - Shift Phot4
4
• QC1DB none px none 0 cov_shift_intphot4
this |
last_yr |
all
L - HIGHP - Shift Phot4
4
• QC1DB none px none 0 cov_shift_intphot4
this |
last_yr |
all
L - HIGHP - Shift Phot4
5
• QC1DB none px none 0 cov_shift_intphot4
this |
last_yr |
all
M - HIGHP - Shift Phot4
5
• QC1DB none px none 0 cov_shift_intphot4
this |
last_yr |
all
M - HIGHP - Shift Phot4
5
• QC1DB none px none 0 cov_shift_intphot4
this |
last_yr |
all
M - HIGHP - Shift Phot4
5
• QC1DB none px none 0 cov_shift_intphot4
this |
last_yr |
all
M - HIGHP - Shift Phot4
6
• QC1DB none px none 8 cov_shift_intphot1
this |
last_yr |
all
AQUARIUS (MATISSE-N) - LOW - Shift Phot1
6
• QC1DB none px none 8 cov_shift_intphot2
this |
last_yr |
all
N - LOW - Shift Phot2
6
• QC1DB none px none 8 cov_shift_intphot3
this |
last_yr |
all
N - LOW - Shift Phot3
6
• QC1DB none px none 8 cov_shift_intphot4
this |
last_yr |
all
N - LOW - Shift Phot4
7
• QC1DB none px none 0 cov_shift_intphot1
this |
last_yr |
all
N - MED - Shift Phot1
7
• QC1DB none px none 0 cov_shift_intphot2
this |
last_yr |
all
N - MED - Shift Pho2t
7
• QC1DB none px none 0 cov_shift_intphot3
this |
last_yr |
all
N - MED - Shift Phot3
7
• QC1DB none px none 0 cov_shift_intphot4
this |
last_yr |
all
N - MED - Shift Phot4
8
• QC1DB none px none 9 cov_shift_intphot1
this |
last_yr |
all
N - HIGH - Shift Phot1
8
• QC1DB none px none 9 cov_shift_intphot2
this |
last_yr |
all
N - LOW - Shift Phot2
8
• QC1DB none px none 9 cov_shift_intphot3
this |
last_yr |
all
N - HIGH - Shift Phot3
8
• QC1DB none px none 9 cov_shift_intphot4
this |
last_yr |
all
N - HIGH - Shift Phot4
*Data sources: QC1DB: QC1 database; LOCAL: local data source
Plot 1 scores: not implemented
data source: matisse_shift dataset: cov_shift_intphot1 • average: none thresholds: none N_data plotted: 8 [click plot for closeup]
Plot 2 scores: not implemented
data source: matisse_shift dataset: cov_shift_intphot1 • average: none thresholds: none N_data plotted: 5 [click plot for closeup]
Plot 3 scores: not implemented
data source: matisse_shift dataset: cov_shift_intphot1 • average: none thresholds: none N_data plotted: 4 [click plot for closeup]
Plot 4 scores: not implemented
data source: matisse_shift dataset: cov_shift_intphot4 • average: none thresholds: none N_data plotted: 0 [click plot for closeup]
Plot 5 scores: not implemented
data source: matisse_shift dataset: cov_shift_intphot4 • average: none thresholds: none N_data plotted: 0 [click plot for closeup]
Plot 6 scores: not implemented
data source: matisse_shift dataset: cov_shift_intphot1 • average: none thresholds: none N_data plotted: 8 [click plot for closeup]
Plot 7 scores: not implemented
data source: matisse_shift dataset: cov_shift_intphot1 • average: none thresholds: none N_data plotted: 0 [click plot for closeup]
Plot 8 scores: not implemented
data source: matisse_shift dataset: cov_shift_intphot1 • average: none thresholds: none N_data plotted: 9 [click plot for closeup]
General information
Click on any of the plots to see a close-up version .
The latest date is indicated on top of the plot.
If configured,
data points belonging to the latest date are specially marked statistical averages are indicated by a solid line, and thresholds by broken lines outliers are marked by a red asterisk. They are defined as data points outside the
threshold lines "aliens" (= data points outside the plot Y limits) are marked by a red arrow (↑ ↓ you can download the data for each parameter set if the 'Data downloads' link shows up
