mirror sites: PL (internal link) HQ     [?]

Health Check monitor


CAL | HC | refs | QC
HealthCheck Monitor
   HOME | UsersGuide
  sl icon ALL INSTRUMENTS
 
all KPI reports
PIONIER:
Detector
Other HC:
QC links:
        [page auto-refreshes after 300 sec]   [stop | on]            [press Ctrl+Shift+R to enforce refresh of scores, dates and news]
PIONIER trending system: HEALTH CHECK report
HELP USERS-GUIDE MORE
Last update: 2024-04-25T02:25:36 (UT)
  | now: 2024-04-25T02:27:34 (UT) muc05 QC pipeline: pioni-3.9.6 (installed 2023-06-22)
same group: Bad_Pixels_science Gain_science   DARK Bad_Pixels Gain
General news: NOTE: The Health Check and calChecker services are moved to qcFlow on an instrument by instrument basis. The current pages will not be updated any longer once the move has been finished.
PIONIER news: 2023-02-06 Internal efficiency, median darks are outside KPI which is related to a pump not working. As operations continue, the thresholds have been adapted to show calibratibility and keep track of sudden anomalies.
Report news:
DATE*: [?] 2024-04-18
report | NLT
2024-04-19
report | NLT
2024-04-20
report | NLT
2024-04-21
report | NLT
2024-04-22
report | NLT
2024-04-23
report | NLT
2024-04-24
no data | NLT
r...
Raw CAL displays:
n/a n/a n/a n/a n/a n/a no CAL raw files
P...
CAL product quality:
products products products products products products no CAL products
 
transfer   ngas [?]

scores&comments | FULL | history ... | plot tutorial ... | contact | HC_docu... | quality events...                 daily/often; important to check     [?]
*Date on this monitor changes at 21:00 UT
png: Information and research:
- png file - advanced studies: QC1 browser | QC1 plotter
Plot
?
Symb
?
Source
*
Average ? Thresholds ? N_
data
QC1
parameter
Data
downloads
Remarks
method value unit method value
1 QC1DB MEDIAN 0.141 NONE VAL0.105,0.17 11 gain_median this | last_yr | all High sensitivity
2 QC1DB MEDIAN 0.388 NONE VAL0.249,0.45 11 gain_median this | last_yr | all Medium sensitivity
3 QC1DB MEDIAN 0.905 NONE VAL0.7,1.2 11 gain_median this | last_yr | all Low sensitivity (detector polarisation voltage 3000mV)
*Data sources: QC1DB: QC1 database; LOCAL: local data source
Plot 1
scores: 1|
data source:pionier_detmon
(QC1 database)
dataset:gain_median
median:0.141NONE
fixed thresholds:0.105...0.17NONE
N_data plotted:11
[click plot for closeup]
Plot 2
scores: 1|
data source:pionier_detmon
(QC1 database)
dataset:gain_median
median:0.388NONE
fixed thresholds:0.249...0.45NONE
N_data plotted:11
[click plot for closeup]
Plot 3
scores: 1|
data source:pionier_detmon
(QC1 database)
dataset:gain_median
median:0.905NONE
fixed thresholds:0.7...1.2NONE
N_data plotted:11
[click plot for closeup]
This plot

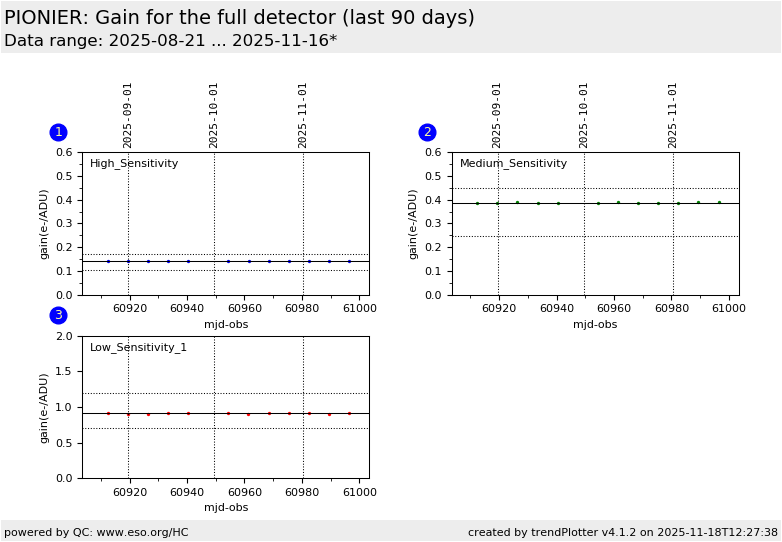
The gain is monitored for the full detector (320x255) and for the "science" pixels (26 windows of 6x1 pixels).
Only the gain across the full detector is scored

The gain has been measured after installation of RAPID (december 2014):
Low_Sensitivity:
- det_polar=1000mv gain=1.398 e-/ADU
- det_polar=3000mv gain=0.861 e-/ADU
Medium_Sensitivity:
- det_polar=5000mv gain=0.296 e-/ADU
High Sensitivity:
- det_polar=7100mv gain=0.107 e-/ADU


General information

Click on any of the plots to see a close-up version.

The latest date is indicated on top of the plot.

If configured,

  • data points belonging to the latest date are specially marked
  • statistical averages are indicated by a solid line, and thresholds by broken lines
  • outliers are marked by a red asterisk. They are defined as data points outside the threshold lines
  • "aliens" (= data points outside the plot Y limits) are marked by a red arrow ( or )
  • you can download the data for each parameter set if the 'Data downloads' link shows up