*Data sources: QC1DB: QC1 database; LOCAL: local text file | **OPS: to indicate that OPSLOG data are included
This plot
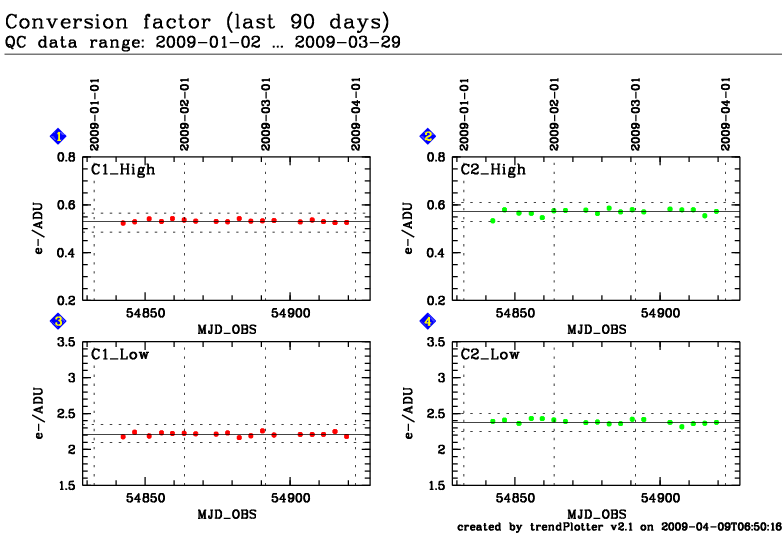
If the exposure time of the first two raw screen flat fields in the
input set of frames is the same (within 4%), the difference frame is
computed. Then the whole readout port is divided into a chessboard of
16x16 boxes. For each one of these boxes, the median signal level from
the first raw frame is divided by the variance in the difference frame
scaled by 2. The median value of the 16x16 values obtained is the
accepted value for the conversion factor.
CONAD QC parameters are trended per readout mode for the R_BESS filter only.
General information
Click on any of the plots to see a close-up version.
The latest date is indicated on top of the plot, data points belonging to that date are specially marked.
If configured,
statistical averages are indicated by a solid line, and thresholds by broken lines
outliers are marked by a red asterisk. They are defined as data points outside the
threshold lines
"aliens" (= data points outside the plot Y limits) are marked by a red arrow (↑ or ↓)
you can download the data for each parameter set if the 'Data downloads' link shows up
