mirror sites: PL (internal link) HQ     [?]

Health Check monitor


CAL | HC | refs | QC
HealthCheck Monitor
   HOME | UsersGuide
  sl icon ALL INSTRUMENTS
 
all KPI reports
FORS1:
lamps: imaging
old CCD
(before 2007-03-25)
Other HC:
QC links:
[page auto-refreshes after 60 sec]            [press Ctrl+R to enforce refresh of scores and dates]
FORS1 trending system: History Plots
Last update: 2009-04-09T06:58:30 (UT)
| now: 2024-04-27T01:07:09 (UT)  
same group: SCR_FF_UB SCR_FF_R SCR_FF_VI
less ... | history ... | plot tutorial ... | contact               [?]
Print: Information and research: News:
- png file - advanced studies: QC1 browser | QC1 plotter
 
Plot
?
Symb
?
Source
*
OPS?
**
Average ? Thresholds ? N_
data
QC1
parameter
Data
downloads
Remarks
method value unit method value
1 QC1DB no MEDIAN 111.92569 ADU 5%± 5.59628 18 efficiency this | last_yr | all C1, U_BESS
2 QC1DB no MEDIAN 91.7119 ADU 5%± 4.5856 18 efficiency this | last_yr | all C2, U_BESS
3 QC1DB no MEDIAN 9569.03418 ADU 5%± 478.45172 18 efficiency this | last_yr | all C1, B_BESS
4 QC1DB no MEDIAN 8347.60156 ADU 5%± 417.38007 18 efficiency this | last_yr | all C2, B_BESS
*Data sources: QC1DB: QC1 database; LOCAL: local text file | **OPS: to indicate that OPSLOG data are included
General information

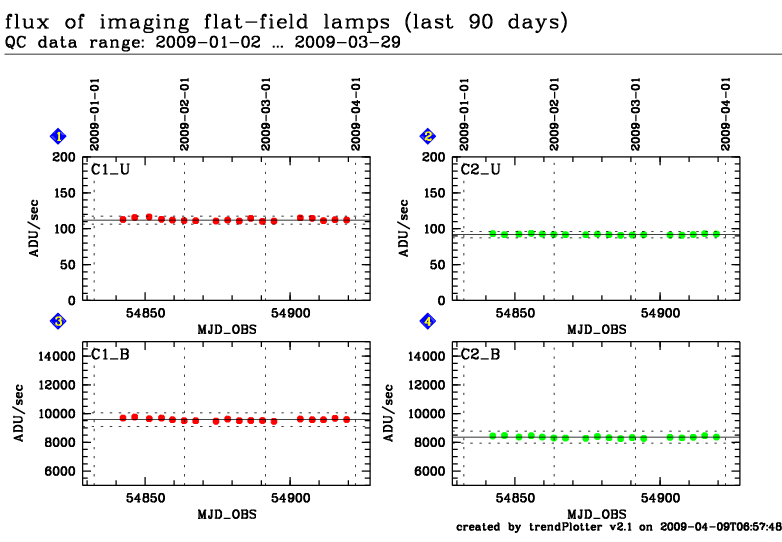
Click on any of the plots to see a close-up version. The latest date is indicated on top of the plot, data points belonging to that date are specially marked.

If configured,

  • statistical averages are indicated by a solid line, and thresholds by broken lines
  • outliers are marked by a red asterisk. They are defined as data points outside the threshold lines
  • "aliens" (= data points outside the plot Y limits) are marked by a red arrow ( or )
  • you can download the data for each parameter set if the 'Data downloads' link shows up