Plot
? |
Symb
? |
Source
* |
Average ? |
Thresholds ? |
N_
data |
QC1
parameter |
Data
downloads |
Remarks |
| method |
value |
unit |
method |
value |
| 1 |
• | QC1DB |
none |
|
ADU |
none | |
425 |
qc_ron23 |
this |
last_yr |
all
|
DARK ReadOut Noise vs. DIT, chip 4 |
| 2 |
• | QC1DB |
none |
|
ADU |
none | |
425 |
qc_ron23 |
this |
last_yr |
all
|
DARK ReadOut Noise vs. DIT, chip 3 |
| 3 |
• | QC1DB |
none |
|
ADU |
none | |
425 |
qc_ron23 |
this |
last_yr |
all
|
DARK ReadOut Noise vs. DIT, chip 4 |
| 4 |
• | QC1DB |
none |
|
ADU |
none | |
425 |
qc_ron23 |
this |
last_yr |
all
|
DARK ReadOut Noise vs. DIT, chip 3 |
| 5 |
• | QC1DB |
none |
|
ADU |
none | |
425 |
qc_ron23 |
this |
last_yr |
all
|
DARK ReadOut Noise vs. DIT, chip 1 |
| 6 |
• | QC1DB |
none |
|
ADU |
none | |
425 |
qc_ron23 |
this |
last_yr |
all
|
DARK ReadOut Noise vs. DIT, chip 2 |
| 7 |
• | QC1DB |
none |
|
ADU |
none | |
425 |
qc_ron23 |
this |
last_yr |
all
|
DARK ReadOut Noise vs. DIT, chip 1 |
| 8 |
• | QC1DB |
none |
|
ADU |
none | |
425 |
qc_ron23 |
this |
last_yr |
all
|
DARK ReadOut Noise vs. DIT, chip 2 |
| |
|
*Data sources: QC1DB: QC1 database; LOCAL: local data source
|
Plot 5
scores: not implemented
| | data source: | hawki_dark
(QC1 database) |
| dataset: | qc_ron23 | • |
| average: | none |
| thresholds: | none |
| N_data plotted: | 425 |
| [click plot for closeup] |
Plot 6
scores: not implemented
| | data source: | hawki_dark
(QC1 database) |
| dataset: | qc_ron23 | • |
| average: | none |
| thresholds: | none |
| N_data plotted: | 425 |
| [click plot for closeup] |
Plot 2
scores: not implemented
| | data source: | hawki_dark
(QC1 database) |
| dataset: | qc_ron23 | • |
| average: | none |
| thresholds: | none |
| N_data plotted: | 425 |
| [click plot for closeup] |
Plot 1
scores: not implemented
| | data source: | hawki_dark
(QC1 database) |
| dataset: | qc_ron23 | • |
| average: | none |
| thresholds: | none |
| N_data plotted: | 425 |
| [click plot for closeup] |
Plot 7
scores: not implemented
| | data source: | hawki_dark
(QC1 database) |
| dataset: | qc_ron23 | • |
| average: | none |
| thresholds: | none |
| N_data plotted: | 425 |
| [click plot for closeup] |
Plot 8
scores: not implemented
| | data source: | hawki_dark
(QC1 database) |
| dataset: | qc_ron23 | • |
| average: | none |
| thresholds: | none |
| N_data plotted: | 425 |
| [click plot for closeup] |
Plot 4
scores: not implemented
| | data source: | hawki_dark
(QC1 database) |
| dataset: | qc_ron23 | • |
| average: | none |
| thresholds: | none |
| N_data plotted: | 425 |
| [click plot for closeup] |
Plot 3
scores: not implemented
| | data source: | hawki_dark
(QC1 database) |
| dataset: | qc_ron23 | • |
| average: | none |
| thresholds: | none |
| N_data plotted: | 425 |
| [click plot for closeup] |
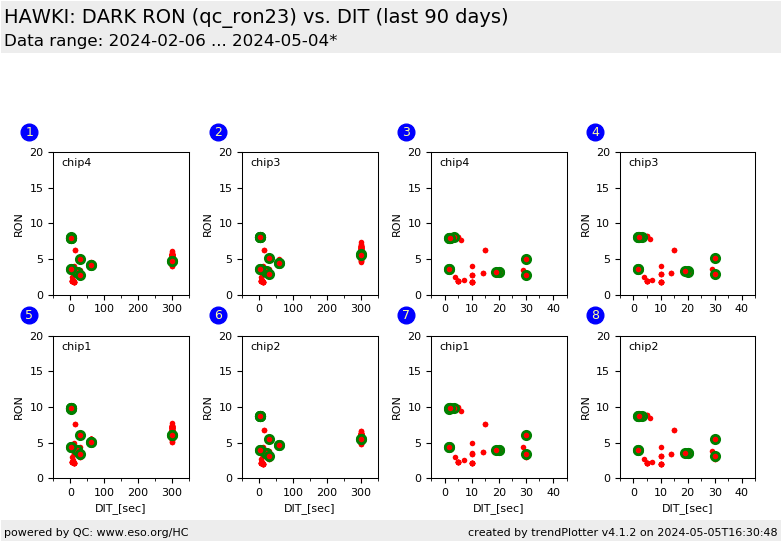
Trending report for correlation between DIT and RON.
Each plot displays the ReadOut Noise as a function of DIT
Name:
Fits header: DET.DIT and QC.RON.MEAN
QC1 DB: det_dit and qc_ron_mean in hawki_dark.
Description:
The mean of the dark ReadOut Noise values is plotted as a function of Detector
Integration Time (DIT).
Setup:
All DITs
These plots describe:
Fig. 1. chip4: The QC parameter QC.RON.MEAN as a funtion of DET.DIT for chip #4.
Fig. 2. chip4: The QC parameter QC.RON.MEAN as a funtion of DET.DIT for chip #3.
Fig. 5. chip4: The QC parameter QC.RON.MEAN as a funtion of DET.DIT for chip #1.
Fig. 6. chip4: The QC parameter QC.RON.MEAN as a funtion of DET.DIT for chip #2.
Fig. 3. chip1: Same as Fig. 1, but showing the detail for DET.DIT less than 45 sec.
Fig. 4. chip1: Same as Fig. 2, but showing the detail for DET.DIT less than 45 sec.
Fig. 7. chip1: Same as Fig. 5, but showing the detail for DET.DIT less than 45 sec.
Fig. 8. chip1: Same as Fig. 6, but showing the detail for DET.DIT less than 45 sec.
Find more information on the HAWKI DARK calibration tutorial page.
General information
Click on any of the plots to see a close-up version.
The latest date is indicated on top of the plot.
If configured,
- data points belonging to the latest date are specially marked
- statistical averages are indicated by a solid line, and thresholds by broken lines
- outliers are marked by a red asterisk. They are defined as data points outside the
threshold lines
- "aliens" (= data points outside the plot Y limits) are marked by a red arrow (↑ or ↓)
- you can download the data for each parameter set if the 'Data downloads' link shows up
|
