mirror sites: PL (internal link) HQ     [?]

Health Check monitor


CAL | HC | refs | QC
HealthCheck Monitor
   HOME | UsersGuide
  sl icon ALL INSTRUMENTS
 
all KPI reports
FORS1:
detector: bias
old CCD
(before 2007-03-25)
Other HC:
QC links:
[page auto-refreshes after 60 sec]            [press Ctrl+R to enforce refresh of scores and dates]
FORS1 trending system: History Plots
Last update: 2009-04-09T06:47:32 (UT)
| now: 2024-04-18T10:11:22 (UT)  
same group: med_master ron_raw ron_master fp_raw struct_raw
less ... | history ... | plot tutorial ... | contact                 daily     [?]
Print: Information and research: News:
- png file - advanced studies: QC1 browser | QC1 plotter
 
Plot
?
Symb
?
Source
*
OPS?
**
Average ? Thresholds ? N_
data
QC1
parameter
Data
downloads
Remarks
method value unit method value
1 QC1DB no MEDIAN 0.83 ADU VAL0.6,1.2 70 FP_r this | last_yr | all 100Kps/2ports/high_gain, 2x2 (only non-zero values are shown)
2 QC1DB no MEDIAN 0.29 ADU VAL0.05,0.55 69 FP_r this | last_yr | all 100Kps/2ports/high_gain, 2x2 (only non-zero values are shown)
3 QC1DB no MEDIAN 0.09 ADU VAL0.,0.25 77 FP_r this | last_yr | all 200Kps/2ports/low_gain, 2x2 (only non-zero values are shown)
4 QC1DB no MEDIAN 0.12 ADU VAL0.,0.25 78 FP_r this | last_yr | all 200Kps/2ports/low_gain, 2x2 (only non-zero values are shown)
*Data sources: QC1DB: QC1 database; LOCAL: local text file | **OPS: to indicate that OPSLOG data are included
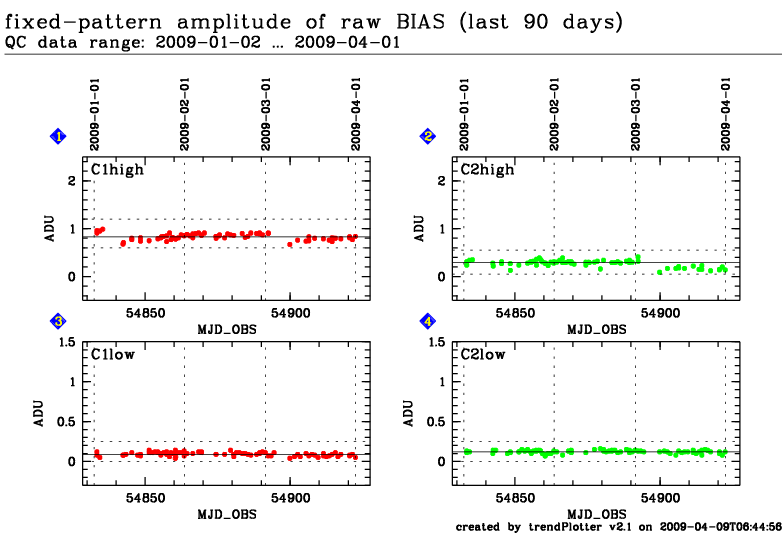
This plot

The difference between the first raw bias and the second raw bias (in ADU) shifted by 10x10 pixels, is computed. This is the combination of fixed pattern noise and read out noise (scaled by sqrt(2)). The population standard deviation of this difference is computed and divided by the square root of 2. The read out noise contribution evaluated as QC OUTi RON is then quadratically subtracted from the total noise.  


General information

Click on any of the plots to see a close-up version. The latest date is indicated on top of the plot, data points belonging to that date are specially marked.

If configured,

  • statistical averages are indicated by a solid line, and thresholds by broken lines
  • outliers are marked by a red asterisk. They are defined as data points outside the threshold lines
  • "aliens" (= data points outside the plot Y limits) are marked by a red arrow ( or )
  • you can download the data for each parameter set if the 'Data downloads' link shows up