*Data sources: QC1DB: QC1 database; LOCAL: local text file | **OPS: to indicate that OPSLOG data are included
This plot
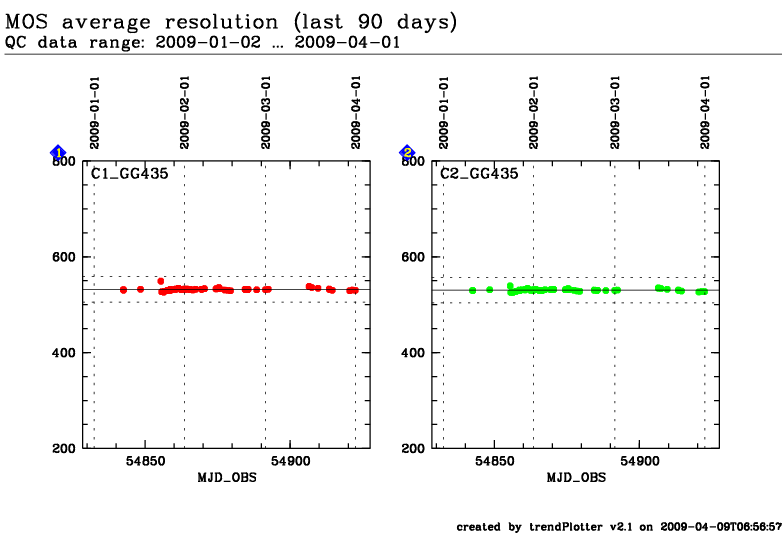
From a wavelength calibrated MOS arc lamp exposure, the mean spectral
resolution from all lines in catalog is computed. Each single spectral
resolution is computed as the ratio between the arc lamp line wavelength and
its FWHM. The
values trended here are for the 300V grism with a slit width of
1.0" and the GG435 order separation filter.
General information
Click on any of the plots to see a close-up version.
The latest date is indicated on top of the plot, data points belonging to that date are specially marked.
If configured,
statistical averages are indicated by a solid line, and thresholds by broken lines
outliers are marked by a red asterisk. They are defined as data points outside the
threshold lines
"aliens" (= data points outside the plot Y limits) are marked by a red arrow (↑ or ↓)
you can download the data for each parameter set if the 'Data downloads' link shows up
