Plot
? |
Symb
? |
Source
* |
Average ? |
Thresholds ? |
N_
data |
QC1
parameter |
Data
downloads |
Remarks |
| method |
value |
unit |
method |
value |
| 1 |
• | QC1DB |
none |
|
el/ADU |
none | |
447 |
conad |
all (full time range)
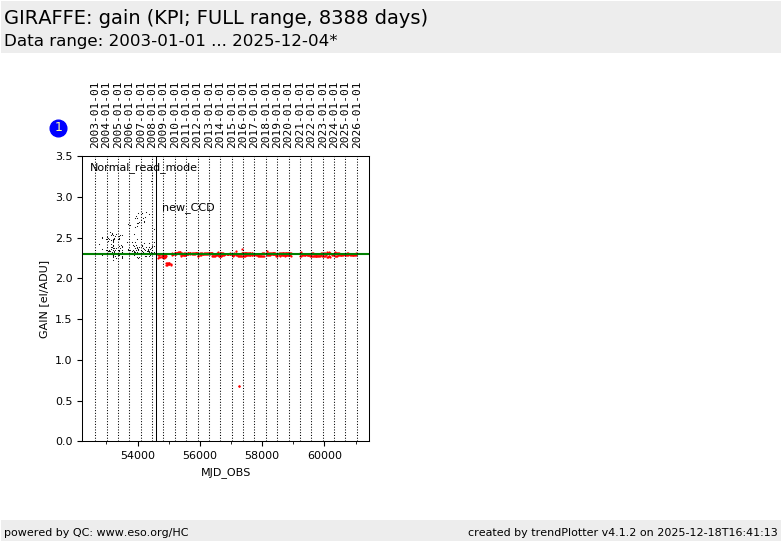
| Gain*, 'Normal' read mode. a) Data for current CCD ("new"); reference: 2.3 e-/ADU, measured on Paranal during commissioning in May 2008.
(*Note: the QC1 parameter is called CONAD by mistake, it should read gain) |
| 1 |
• | QC1DB |
none |
|
el/ADU |
none | |
193 |
conad |
all (full time range)
| b) Data for old CCD, until 2008. |
| |
|
*Data sources: QC1DB: QC1 database; LOCAL: local data source
|
| Plot 1 | | data source: | giraffe_ccd
(QC1 database) |
dataset:
(numbers below apply to this dataset) | conad | • |
| average: | none |
| thresholds: | none |
| N_data plotted: | 447 |
| (current) reference: | 2.3 |
| [click plot for closeup] |
This is the instrument performance plot for the GIRAFFE gain. Only the
'normal' read mode is monitored.
The QC1 parameter is called CONAD by mistake, it should read gain. The
reference value (2.3 e-/ADU) is currently identical to the median of the measured
values.
The label 'new CCD' refers to the current CCD in use since May 2008.
General information
Click on any of the plots to see a close-up version.
The latest date is indicated on top of the plot.
If configured,
- data points belonging to the latest date are specially marked
- statistical averages are indicated by a solid line, and thresholds by broken lines
- outliers are marked by a red asterisk. They are defined as data points outside the
threshold lines
- "aliens" (= data points outside the plot Y limits) are marked by a red arrow (↑ or ↓)
- you can download the data for each parameter set if the 'Data downloads' link shows up
|
