Plot
? |
Symb
? |
Source
* |
Average ? |
Thresholds ? |
N_
data |
QC1
parameter |
Data
downloads |
Remarks |
| method |
value |
unit |
method |
value |
| 1 |
• | QC1DB |
MEDIAN |
132 |
number |
VAL | 132,135 |
36 |
num_fib |
this |
last_yr |
all
|
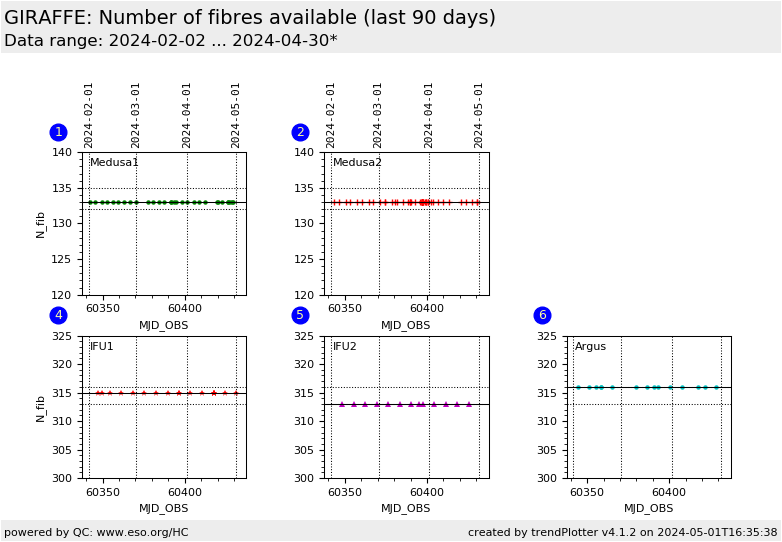
Number of fibres (found in the localization solution of the FLATs), from L543.1 reference setting; Medusa1 |
| 2 |
+ | QC1DB |
MEDIAN |
133 |
number |
VAL | 132,135 |
28 |
num_fib |
this |
last_yr |
all
|
same for Medusa2 |
| 4 |
∗ | QC1DB |
MEDIAN |
315 |
number |
VAL | 313,316 |
12 |
num_fib |
this |
last_yr |
all
|
same for IFU1 |
| 5 |
▲ | QC1DB |
MEDIAN |
313 |
number |
VAL | 313,316 |
14 |
num_fib |
this |
last_yr |
all
|
same for IFU2 |
| 6 |
• | QC1DB |
MEDIAN |
316 |
number |
VAL | 313,316 |
15 |
num_fib |
this |
last_yr |
all
|
same for Argus |
| |
|
*Data sources: QC1DB: QC1 database; LOCAL: local data source
|
Plot 1
scores:  3| 3|
| | data source: | giraffe_flat
(QC1 database) |
| dataset: | num_fib | • |
| median: | 132 | number |
| fixed thresholds: | 132...135 | number |
| N_data plotted: | 36 |
| [click plot for closeup] |
Plot 2
scores: 1|
| | data source: | giraffe_flat
(QC1 database) |
| dataset: | num_fib | + |
| median: | 133 | number |
| fixed thresholds: | 132...135 | number |
| N_data plotted: | 28 |
| [click plot for closeup] |
Plot 4
scores: 1|
| | data source: | giraffe_flat
(QC1 database) |
| dataset: | num_fib | ∗ |
| median: | 315 | number |
| fixed thresholds: | 313...316 | number |
| N_data plotted: | 12 |
| [click plot for closeup] |
Plot 5
scores: 1|
| | data source: | giraffe_flat
(QC1 database) |
| dataset: | num_fib | ▲ |
| median: | 313 | number |
| fixed thresholds: | 313...316 | number |
| N_data plotted: | 14 |
| [click plot for closeup] |
Plot 6
scores: 3|
| | data source: | giraffe_flat
(QC1 database) |
| dataset: | num_fib | • |
| median: | 316 | number |
| fixed thresholds: | 313...316 | number |
| N_data plotted: | 15 |
| [click plot for closeup] |
This is the trending plot for the localization of fibres in the GIRAFFE
flat field calibration data. We display the QC1 parameter num_fib
(PRO.SLIT.NFIBRES). The purpose of this plot is to check the number of
available fibres. A sudden deviation from the nominal behaviour indicates
issues with broken fibres, but might also indicate pipeline problems or fibre
illumination problems.
The plots are arranged per fibre system. Here we show the regular Health Check
calibrations only, taken as L543.1 setting every 3rd day in the Medusa slits,
and once a week for the IFU and Argus slits.
A more detailed record of the performance of each fibre, and a record of the
available/missing fibres, is available here.
You may want to check a raw file visually against the reference
raw file displays.
General information
Click on any of the plots to see a close-up version.
The latest date is indicated on top of the plot.
If configured,
- data points belonging to the latest date are specially marked
- statistical averages are indicated by a solid line, and thresholds by broken lines
- outliers are marked by a red asterisk. They are defined as data points outside the
threshold lines
- "aliens" (= data points outside the plot Y limits) are marked by a red arrow (↑ or ↓)
- you can download the data for each parameter set if the 'Data downloads' link shows up
|
