Plot
? |
Symb
? |
Source
* |
Average ? |
Thresholds ? |
N_
data |
QC1
parameter |
Data
downloads |
Remarks |
| method |
value |
unit |
method |
value |
| 1 |
• | QC1DB |
MEDIAN |
132 |
number |
VAL | 130,136 |
59 |
num_fib |
this |
last_yr |
all
|
FLATs: number of localized fibres, all settings; Medusa1 |
| 1 |
• | QC1DB |
none |
|
number |
none | |
36 |
num_fib |
this |
last_yr |
all
|
L543.1 only (for reference) |
| 2 |
+ | QC1DB |
MEDIAN |
133 |
number |
VAL | 132,136 |
60 |
num_fib |
this |
last_yr |
all
|
same as plot 1, Medusa2 |
| 2 |
+ | QC1DB |
none |
|
number |
none | |
28 |
num_fib |
this |
last_yr |
all
|
L543.1 only (for reference) |
| 4 |
∗ | QC1DB |
MEDIAN |
315 |
number |
VAL | 313,316 |
14 |
num_fib |
this |
last_yr |
all
|
same as plot 1, IFU1 |
| 4 |
∗ | QC1DB |
none |
|
number |
none | |
12 |
num_fib |
this |
last_yr |
all
|
L543.1 only (for reference) |
| 5 |
▲ | QC1DB |
MEDIAN |
313 |
number |
VAL | 311,315 |
16 |
num_fib |
this |
last_yr |
all
|
same as plot 3, IFU2 |
| 5 |
▲ | QC1DB |
none |
|
number |
none | |
14 |
num_fib |
this |
last_yr |
all
|
L543.1 only (for reference) |
| 6 |
• | QC1DB |
MEDIAN |
316 |
number |
VAL | 314,318 |
32 |
num_fib |
this |
last_yr |
all
|
same as plot 3, Argus |
| 6 |
• | QC1DB |
none |
|
number |
none | |
15 |
num_fib |
this |
last_yr |
all
|
L543.1 only (for reference) |
| |
|
*Data sources: QC1DB: QC1 database; LOCAL: local data source
|
Plot 1
scores:  3| 3|
| | data source: | giraffe_flat
(QC1 database) |
dataset:
(numbers below apply to this dataset) | num_fib | • |
| median: | 132 | number |
| fixed thresholds: | 130...136 | number |
| N_data plotted: | 59 |
| [click plot for closeup] |
Plot 2
scores: 2|
| | data source: | giraffe_flat
(QC1 database) |
dataset:
(numbers below apply to this dataset) | num_fib | + |
| median: | 133 | number |
| fixed thresholds: | 132...136 | number |
| N_data plotted: | 60 |
| [click plot for closeup] |
Plot 4
scores: 1|
| | data source: | giraffe_flat
(QC1 database) |
dataset:
(numbers below apply to this dataset) | num_fib | ∗ |
| median: | 315 | number |
| fixed thresholds: | 313...316 | number |
| N_data plotted: | 14 |
| [click plot for closeup] |
Plot 5
scores: 1|
| | data source: | giraffe_flat
(QC1 database) |
dataset:
(numbers below apply to this dataset) | num_fib | ▲ |
| median: | 313 | number |
| fixed thresholds: | 311...315 | number |
| N_data plotted: | 16 |
| [click plot for closeup] |
Plot 6
scores: 8|
| | data source: | giraffe_flat
(QC1 database) |
dataset:
(numbers below apply to this dataset) | num_fib | • |
| median: | 316 | number |
| fixed thresholds: | 314...318 | number |
| N_data plotted: | 32 |
| [click plot for closeup] |
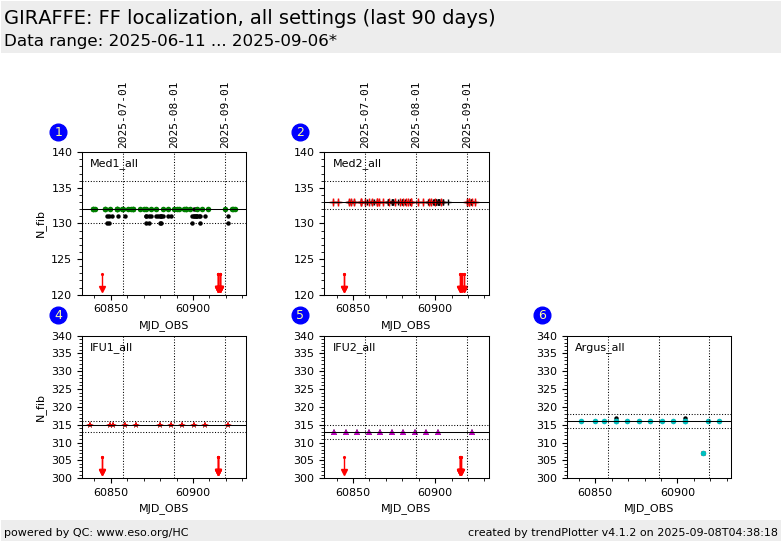
This is the trending plot for the proper localization of fibres in the GIRAFFE
flat field calibration data. We display the QC1 parameter num_fib
(PRO.SLIT.NFIBRES). The purpose of this plot is to detect fibres with missing
signal (broken fibres, un-illuminated ones), or pipeline failures.
The plots are arranged per fibre system.
Within each fibre system, all settings are displayed. Their
num_fib parameter should be almost the same (see below). Hence both the regular Health Check
calibration, and the science-driven daytime calibrations are included here.
The IFU
settings show some small variation around 315 since some of the last fibres
may be truncated, depending on the setting. Most likely, problems will show
up only per fibre bundle (sets of 20 fibres).
A detailed record of the performance of each fibre, and a record of the
available/missing fibres, is available here.
You may want to check a raw file visually against the reference
raw file displays.
General information
Click on any of the plots to see a close-up version.
The latest date is indicated on top of the plot.
If configured,
- data points belonging to the latest date are specially marked
- statistical averages are indicated by a solid line, and thresholds by broken lines
- outliers are marked by a red asterisk. They are defined as data points outside the
threshold lines
- "aliens" (= data points outside the plot Y limits) are marked by a red arrow (↑ or ↓)
- you can download the data for each parameter set if the 'Data downloads' link shows up
|
