Plot
? |
Symb
? |
Source
* |
Average ? |
Thresholds ? |
N_
data |
QC1
parameter |
Data
downloads |
Remarks |
| method |
value |
unit |
method |
value |
| 1 |
• | QC1DB |
none |
|
pix |
none | |
2160 |
rms_fit |
all (full time range)
| rms of fitted lines (pix), high-resolution grating HR.
HC setting H525.8B
Medusa1 |
| 1 |
• | QC1DB |
none |
|
pix |
none | |
20 |
rms_fit |
all (full time range)
| same, initial years, from reprocessing |
| 2 |
x | QC1DB |
none |
|
pix |
none | |
2138 |
rms_fit |
all (full time range)
| Medusa2 |
| 2 |
x | QC1DB |
none |
|
pix |
none | |
18 |
rms_fit |
all (full time range)
| same, initial years, from reprocessing |
| 3 |
∗ | QC1DB |
none |
|
pix |
none | |
1025 |
rms_fit |
all (full time range)
| IFU1 |
| 4 |
▲ | QC1DB |
none |
|
pix |
none | |
1046 |
rms_fit |
all (full time range)
| IFU2 |
| 5 |
• | QC1DB |
none |
|
pix |
none | |
1019 |
rms_fit |
all (full time range)
| Argus |
|
| 6 |
• | QC1DB |
none |
|
pix |
none | |
2463 |
rms_fit |
all (full time range)
| rms of fitted lines (pix), low-resolution grating LR.
HC setting L543.1
Medusa1 |
| 6 |
• | QC1DB |
none |
|
pix |
none | |
43 |
rms_fit |
all (full time range)
| same, initial years, from reprocessing |
| 7 |
x | QC1DB |
none |
|
pix |
none | |
2453 |
rms_fit |
all (full time range)
| Medusa2 |
| 7 |
x | QC1DB |
none |
|
pix |
none | |
47 |
rms_fit |
all (full time range)
| same, initial years, from reprocessing |
| |
|
*Data sources: QC1DB: QC1 database; LOCAL: local data source
|
| Plot 1 | | data source: | giraffe_wave
(QC1 database) |
dataset:
(numbers below apply to this dataset) | rms_fit | • |
| average: | none |
| thresholds: | none |
| N_data plotted: | 2160 |
| (current) reference: | 0.15 |
| [click plot for closeup] |
| Plot 2 | | data source: | giraffe_wave
(QC1 database) |
dataset:
(numbers below apply to this dataset) | rms_fit | x |
| average: | none |
| thresholds: | none |
| N_data plotted: | 2138 |
| (current) reference: | 0.15 |
| [click plot for closeup] |
| Plot 3 | | data source: | giraffe_wave
(QC1 database) |
| dataset: | rms_fit | ∗ |
| average: | none |
| thresholds: | none |
| N_data plotted: | 1025 |
| (current) reference: | 0.097 |
| [click plot for closeup] |
| Plot 4 | | data source: | giraffe_wave
(QC1 database) |
| dataset: | rms_fit | ▲ |
| average: | none |
| thresholds: | none |
| N_data plotted: | 1046 |
| (current) reference: | 0.097 |
| [click plot for closeup] |
| Plot 5 | | data source: | giraffe_wave
(QC1 database) |
| dataset: | rms_fit | • |
| average: | none |
| thresholds: | none |
| N_data plotted: | 1019 |
| (current) reference: | 0.095 |
| [click plot for closeup] |
| Plot 6 | | data source: | giraffe_wave
(QC1 database) |
dataset:
(numbers below apply to this dataset) | rms_fit | • |
| average: | none |
| thresholds: | none |
| N_data plotted: | 2463 |
| (current) reference: | 0.20 |
| [click plot for closeup] |
| Plot 7 | | data source: | giraffe_wave
(QC1 database) |
dataset:
(numbers below apply to this dataset) | rms_fit | x |
| average: | none |
| thresholds: | none |
| N_data plotted: | 2453 |
| (current) reference: | 0.20 |
| [click plot for closeup] |
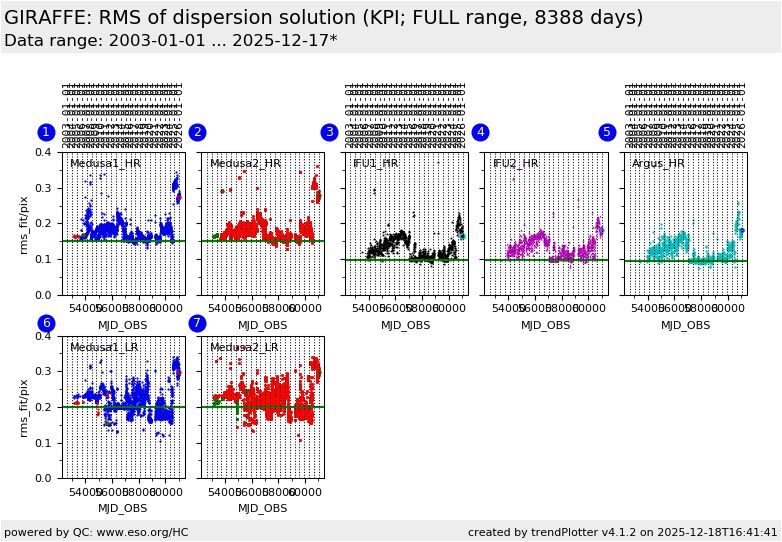
This is the instrument performance plot for the quality of the dispersion
solution of GIRAFFE.
There are five different fibre systems: Medusa1/2, IFU1/2, and
Argus, and two different gratings, HR and LR. For the HR grating, we display
the rms of the residuals of the accepted line
positions against the dispersion
solution, rms_fit (PRO.WSOL.RMS).
HC data are taken
every 3 days for the Medusa slits, and every 7 days for the IFU/Argus slits.
The monitoring is done in the H525.8B setting for the HR grating and L543.1
for the LR grating. For the LR grating,
only the two Medusa settings are taken.
While the rms parameter describes the accuracy of the achieved wavelength
solution, there is no documented reference value for it. We have decided to
mark the best observed value for each fibre system, considering a reasonable
uncertainty of the measurements. This uncertainty is particularly high for the LR values.
Some of the values for early epochs (until 2005)
have been reprocessed with the current pipeline (giraf-2.5 and higher), they are displayed as
separate
datasets as indicated in plots #1, #2, #6, and #7. They do not show systematic
differences.
The observed
degradation in the HR resolution, in particular between 2013 and 2015 was real. It was successfully remedied by an
intervention, with the values being more stable and close to their optimal level since then.
The difference between the HR Medusa1/2 and the IFU/Argus slits is due to
different fibre diameters (higher resolution, fewer blends).
General information
Click on any of the plots to see a close-up version.
The latest date is indicated on top of the plot.
If configured,
- data points belonging to the latest date are specially marked
- statistical averages are indicated by a solid line, and thresholds by broken lines
- outliers are marked by a red asterisk. They are defined as data points outside the
threshold lines
- "aliens" (= data points outside the plot Y limits) are marked by a red arrow (↑ or ↓)
- you can download the data for each parameter set if the 'Data downloads' link shows up
|
