Plot
? |
Symb
? |
Source
* |
Average ? |
Thresholds ? |
N_
data |
QC1
parameter |
Data
downloads |
Remarks |
| method |
value |
unit |
method |
value |
| 1 |
• | QC1DB |
none |
|
number |
VAL | 0,1000 |
59 |
qc_numsat |
this |
last_yr |
all
|
flat field saturation, all Medusa1 settings |
| 1 |
• | QC1DB |
none |
|
number |
none | |
36 |
qc_numsat |
this |
last_yr |
all
|
L543.1 only (for reference) |
| 2 |
+ | QC1DB |
none |
|
number |
VAL | 0,1000 |
60 |
qc_numsat |
this |
last_yr |
all
|
as plot 1, Medusa2 |
| 2 |
+ | QC1DB |
none |
|
number |
none | |
28 |
qc_numsat |
this |
last_yr |
all
|
L543.1 only (for reference) |
| 4 |
∗ | QC1DB |
none |
|
number |
VAL | 0,1000 |
14 |
qc_numsat |
this |
last_yr |
all
|
as plot 1, IFU1 |
| 4 |
∗ | QC1DB |
none |
|
number |
none | |
12 |
qc_numsat |
this |
last_yr |
all
|
L543.1 only (for reference) |
| 5 |
▲ | QC1DB |
none |
|
number |
VAL | 0,1000 |
15 |
qc_numsat |
this |
last_yr |
all
|
as plot 1, IFU2 |
| 5 |
▲ | QC1DB |
none |
|
number |
none | |
13 |
qc_numsat |
this |
last_yr |
all
|
L543.1 only (for reference) |
| 6 |
• | QC1DB |
none |
|
number |
VAL | 0,1000 |
33 |
qc_numsat |
this |
last_yr |
all
|
as plot 1, Argus |
| 6 |
• | QC1DB |
none |
|
number |
none | |
16 |
qc_numsat |
this |
last_yr |
all
|
L543.1 only (for reference) |
| |
|
*Data sources: QC1DB: QC1 database; LOCAL: local data source
|
Plot 1
scores:  3| 3|
| | data source: | giraffe_flat
(QC1 database) |
dataset:
(numbers below apply to this dataset) | qc_numsat | • |
| average: | none |
| fixed thresholds: | 0...1000 | number |
| N_data plotted: | 59 |
| [click plot for closeup] |
Plot 2
scores: 3|
| | data source: | giraffe_flat
(QC1 database) |
dataset:
(numbers below apply to this dataset) | qc_numsat | + |
| average: | none |
| fixed thresholds: | 0...1000 | number |
| N_data plotted: | 60 |
| [click plot for closeup] |
Plot 4
scores: 1|
| | data source: | giraffe_flat
(QC1 database) |
dataset:
(numbers below apply to this dataset) | qc_numsat | ∗ |
| average: | none |
| fixed thresholds: | 0...1000 | number |
| N_data plotted: | 14 |
| [click plot for closeup] |
Plot 5
scores: 1|
| | data source: | giraffe_flat
(QC1 database) |
dataset:
(numbers below apply to this dataset) | qc_numsat | ▲ |
| average: | none |
| fixed thresholds: | 0...1000 | number |
| N_data plotted: | 15 |
| [click plot for closeup] |
Plot 6
scores: 1|
| | data source: | giraffe_flat
(QC1 database) |
dataset:
(numbers below apply to this dataset) | qc_numsat | • |
| average: | none |
| fixed thresholds: | 0...1000 | number |
| N_data plotted: | 33 |
| [click plot for closeup] |
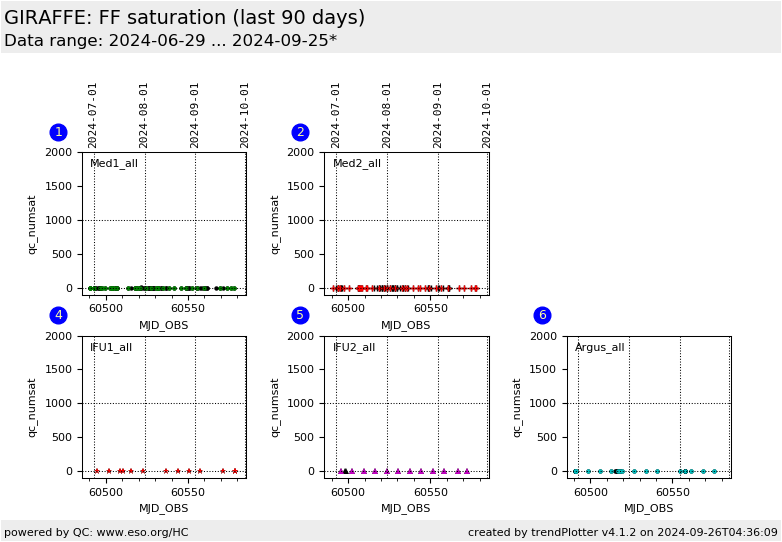
This is the Health Check plot for checking saturation of GIRAFFE
flat field calibration data.
A saturated flat field can still be used for localization of the fibre signal
(unless in extreme cases), but the information related to pixel-to-pixel gain
variations, to fringing and to fibre-to-fibre sensitivity is lost in the
saturated regions. Therefore all measured flats are monitored in terms of
saturated pixels.
We display the QC1 parameter qc_numsat
(QC.NUMSAT) which registers the number of pixels close or at saturation (> 60,000 ADU).
The alert level is set to 1000 ADU which is more or less arbitrary but
experience shows that data with higher values indeed have an issue.
This plot monitors all
flat field data. The HC flats (L543.1) are displayed in colour.
The values are usually 0, a flat with saturation stands out clearly. The upper
threshold is more or less arbitrary, it is used to get an alert.
General information
Click on any of the plots to see a close-up version.
The latest date is indicated on top of the plot.
If configured,
- data points belonging to the latest date are specially marked
- statistical averages are indicated by a solid line, and thresholds by broken lines
- outliers are marked by a red asterisk. They are defined as data points outside the
threshold lines
- "aliens" (= data points outside the plot Y limits) are marked by a red arrow (↑ or ↓)
- you can download the data for each parameter set if the 'Data downloads' link shows up
|
