|
|
 |
|
|
| GRAVITY trending system: HEALTH CHECK report |
|
|
| Last update: 2026-08-02T18:35:21 (UT)
|
|
|
|
|
| General news: |
NOTE: The Health Check and calChecker services have been moved to qcFlow. These pages are only maintained for comparison
and will be removed in 2026.
|
|
GRAVITY news:
|
|
Report news:

|
|
|
|
|
|
|

|
|
|
Plot
? |
Symb
? |
Source
* |
Average ? |
Thresholds ? |
N_
data |
QC1
parameter |
Data
downloads |
Remarks |
| method |
value |
unit |
method |
value |
| 1 |
• | QC1DB |
MEDIAN |
|
none |
VAL | -0.001,0.001 |
0 |
beta_corr_min |
this |
last_yr |
all
|
minimum difference of fibre dispersion index compared to pipeline reference |
| 2 |
• | QC1DB |
MEDIAN |
|
none |
VAL | -0.001,0.001 |
0 |
beta_corr_max |
this |
last_yr |
all
|
maximum difference of fibre dispersion index compared to pipeline reference |
| 3 |
• | QC1DB |
MEDIAN |
|
none |
none | |
0 |
beta_corr_range |
this |
last_yr |
all
|
rangeof fibre dispersion index compared to pipeline reference |
| 4 |
• | QC1DB |
MEDIAN |
|
m |
none | |
0 |
gdelay_rms |
this |
last_yr |
all
|
RMS of group delay, in metre |
| |
|
*Data sources: QC1DB: QC1 database; LOCAL: local data source
|
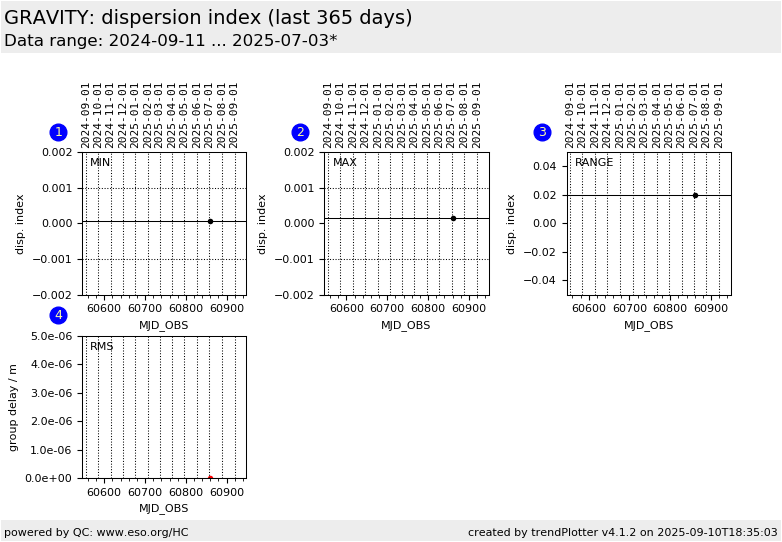
Plot 1
scores: not implemented
| | data source: | gravity_dispersion
(QC1 database) |
| dataset: | beta_corr_min | • |
| median: | no data | none |
| fixed thresholds: | -0.001...0.001 | none |
| N_data plotted: | 0 |
| [click plot for closeup] |
Plot 2
scores: not implemented
| | data source: | gravity_dispersion
(QC1 database) |
| dataset: | beta_corr_max | • |
| median: | no data | none |
| fixed thresholds: | -0.001...0.001 | none |
| N_data plotted: | 0 |
| [click plot for closeup] |
Plot 3
scores: not implemented
| | data source: | gravity_dispersion
(QC1 database) |
| dataset: | beta_corr_range | • |
| median: | no data | none |
| thresholds: | none | |
| N_data plotted: | 0 |
| [click plot for closeup] |
Plot 4
scores: not implemented
| | data source: | gravity_dispersion
(QC1 database) |
| dataset: | gdelay_rms | • |
| median: | no data | m |
| thresholds: | none | |
| N_data plotted: | 0 |
| [click plot for closeup] |
Trending plot for fibre dispersion index.
General information
Click on any of the plots to see a close-up version.
The latest date is indicated on top of the plot.
If configured,
- data points belonging to the latest date are specially marked
- statistical averages are indicated by a solid line, and thresholds by broken lines
- outliers are marked by a red asterisk. They are defined as data points outside the
threshold lines
- "aliens" (= data points outside the plot Y limits) are marked by a red arrow (↑ or ↓)
- you can download the data for each parameter set if the 'Data downloads' link shows up
|
|
|