Plot
? |
Symb
? |
Source
* |
Average ? |
Thresholds ? |
N_
data |
QC1
parameter |
Data
downloads |
Remarks |
| method |
value |
unit |
method |
value |
| 1 |
• | QC1DB |
MEDIAN |
-6.55e-06 |
microns |
none | |
23 |
wdiff6 |
this |
last_yr |
all
|
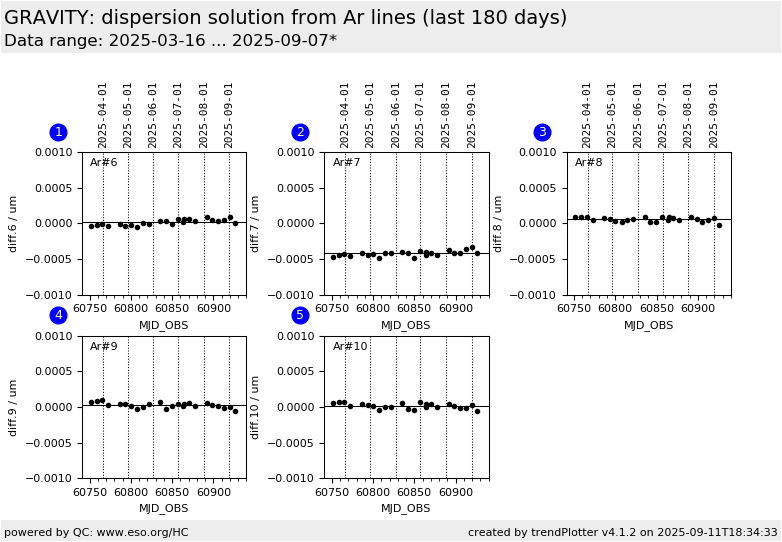
accuracy of wavelength solution for Ar line 6 at 2.154 microns |
| 2 |
• | QC1DB |
MEDIAN |
-0.000433 |
microns |
none | |
23 |
wdiff7 |
this |
last_yr |
all
|
accuracy of wavelength solution for Ar line 7 at 2.208 microns |
| 3 |
• | QC1DB |
MEDIAN |
8.03e-05 |
microns |
none | |
23 |
wdiff8 |
this |
last_yr |
all
|
accuracy of wavelength solution for Ar line 8 at 2.314 microns |
| 4 |
• | QC1DB |
MEDIAN |
4.87e-05 |
microns |
none | |
23 |
wdiff9 |
this |
last_yr |
all
|
accuracy of wavelength solution for Ar line 9 at 2.385 microns |
| 5 |
• | QC1DB |
MEDIAN |
2.61e-05 |
microns |
none | |
23 |
wdiff10 |
this |
last_yr |
all
|
accuracy of wavelength solution for Ar line 10 at 2.397 microns |
| |
|
*Data sources: QC1DB: QC1 database; LOCAL: local data source
|
Plot 1
scores: not implemented
| | data source: | gravity_wavelamp
(QC1 database) |
| dataset: | wdiff6 | • |
| median: | -6.55e-06 | microns |
| thresholds: | none | |
| N_data plotted: | 23 |
| [click plot for closeup] |
Plot 2
scores: not implemented
| | data source: | gravity_wavelamp
(QC1 database) |
| dataset: | wdiff7 | • |
| median: | -0.000433 | microns |
| thresholds: | none | |
| N_data plotted: | 23 |
| [click plot for closeup] |
Plot 3
scores: not implemented
| | data source: | gravity_wavelamp
(QC1 database) |
| dataset: | wdiff8 | • |
| median: | 8.03e-05 | microns |
| thresholds: | none | |
| N_data plotted: | 23 |
| [click plot for closeup] |
Plot 4
scores: not implemented
| | data source: | gravity_wavelamp
(QC1 database) |
| dataset: | wdiff9 | • |
| median: | 4.87e-05 | microns |
| thresholds: | none | |
| N_data plotted: | 23 |
| [click plot for closeup] |
Plot 5
scores: not implemented
| | data source: | gravity_wavelamp
(QC1 database) |
| dataset: | wdiff10 | • |
| median: | 2.61e-05 | microns |
| thresholds: | none | |
| N_data plotted: | 23 |
| [click plot for closeup] |
Trending plot for wavelength calibration using Ar arc lamp.
The plot monitors the differences between the calatalogue Ar wavelength
and the wavelength from the dispersion solution for the SC detector
and MEDIUM resolution. There are ten lines in total, split between two plots.
In addition, there is also the RMS of the differences (on plot 1 only).
General information
Click on any of the plots to see a close-up version.
The latest date is indicated on top of the plot.
If configured,
- data points belonging to the latest date are specially marked
- statistical averages are indicated by a solid line, and thresholds by broken lines
- outliers are marked by a red asterisk. They are defined as data points outside the
threshold lines
- "aliens" (= data points outside the plot Y limits) are marked by a red arrow (↑ or ↓)
- you can download the data for each parameter set if the 'Data downloads' link shows up
|
