|
|
| MIDI trending system: HEALTH CHECK report |
|
|
| Last update: 2015-03-06T18:26:16 (UT)
|
|
|
|
|
| General news: |
NOTE: The Health Check and calChecker services have been moved to qcFlow. These pages are only maintained for comparison
and will be removed in 2026.
|
|
MIDI news:
|
2015-03-04: last night of MIDI operations
|
Report news:

|
|
|
|
|
|
|

|
|
|
Plot
? |
Symb
? |
Source
* |
Average ? |
Thresholds ? |
N_
data |
QC1
parameter |
Data
downloads |
Remarks |
| method |
value |
unit |
method |
value |
| 1 |
• | QC1DB |
none |
|
Pa |
VAL | 0,0.001 |
183 |
sensor_pressure |
this |
last_yr |
all
|
cryostat pressure (sensor value, Pa) |
| 2 |
• | QC1DB |
none |
|
K |
VAL | 33.5,38 |
183 |
temp_camera |
this |
last_yr |
all
|
average cryostat temperature (K) |
| |
|
*Data sources: QC1DB: QC1 database; LOCAL: local data source
|
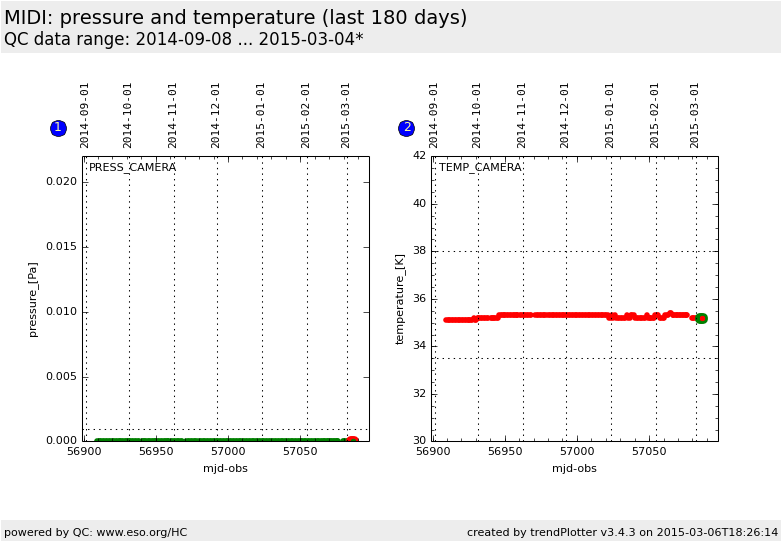
Plot 1
scores: not implemented
| | data source: | midi_detron
(QC1 database) |
| dataset: | sensor_pressure | • |
| average: | none |
| fixed thresholds: | 0...0.001 | Pa |
| N_data plotted: | 183 |
| [click on plot for closeup] |
Plot 2
scores: not implemented
| | data source: | midi_detron
(QC1 database) |
| dataset: | temp_camera | • |
| average: | none |
| fixed thresholds: | 33.5...38 | K |
| N_data plotted: | 183 |
| [click on plot for closeup] |
Here we monitor the pressure (INS.PRES1.MEAN) and temperature (INS.TEMP1.MEAN) of the camera.
General information
Click on any of the plots to see a close-up version.
The latest date is indicated on top of the plot.
If configured,
- data points belonging to the latest date are specially marked
- statistical averages are indicated by a solid line, and thresholds by broken lines
- outliers are marked by a red asterisk. They are defined as data points outside the
threshold lines
- "aliens" (= data points outside the plot Y limits) are marked by a red arrow (↑ or ↓)
- you can download the data for each parameter set if the 'Data downloads' link shows up
|