Plot
? |
Symb
? |
Source
* |
Average ? |
Thresholds ? |
N_
data |
QC1
parameter |
Data
downloads |
Remarks |
| method |
value |
unit |
method |
value |
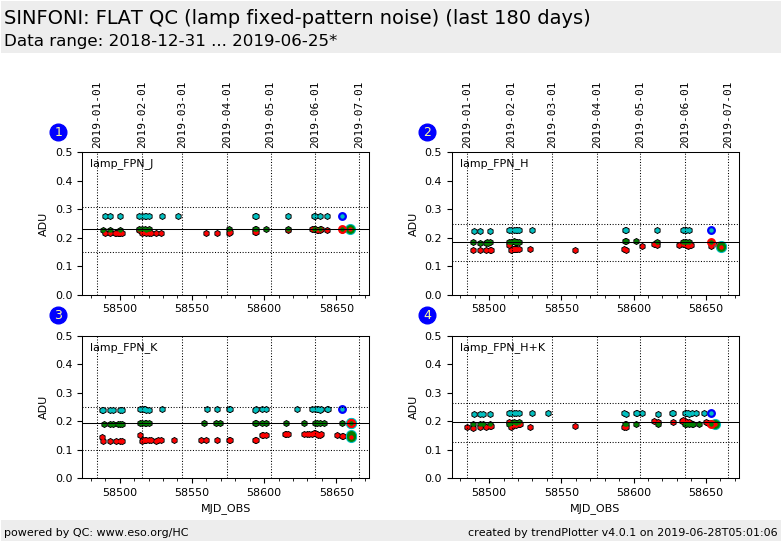
| 1 |
o | QC1DB |
MEDIAN |
0.229 |
ADU |
35% | ± 0.0801 |
69 |
qc_lflat_fpn1 |
this |
last_yr |
all
|
fixed pattern noise (region 1): J-band ALL camera scales
(this FULL data set is scored) |
| 1 |
• | QC1DB |
none |
|
ADU |
none | |
34 |
qc_lflat_fpn1 |
this |
last_yr |
all
|
fixed pattern noise (region 1): J-band/250 mas scale |
| 1 |
• | QC1DB |
none |
|
ADU |
none | |
17 |
qc_lflat_fpn1 |
this |
last_yr |
all
|
fixed pattern noise (region 1): J-band/100 mas scale |
| 1 |
• | QC1DB |
none |
|
ADU |
none | |
18 |
qc_lflat_fpn1 |
this |
last_yr |
all
|
fixed pattern noise (region 1): J-band/ 25 mas scale |
|
| 2 |
o | QC1DB |
MEDIAN |
0.183 |
ADU |
35% | ± 0.0641 |
73 |
qc_lflat_fpn1 |
this |
last_yr |
all
|
fixed pattern noise (region 1): H-band ALL camera scales
(this FULL data set is scored) |
| 2 |
• | QC1DB |
none |
|
ADU |
none | |
33 |
qc_lflat_fpn1 |
this |
last_yr |
all
|
fixed pattern noise (region 1): H-band/250 mas scale |
| 2 |
• | QC1DB |
none |
|
ADU |
none | |
22 |
qc_lflat_fpn1 |
this |
last_yr |
all
|
fixed pattern noise (region 1): H-band/100 mas scale |
| 2 |
• | QC1DB |
none |
|
ADU |
none | |
18 |
qc_lflat_fpn1 |
this |
last_yr |
all
|
fixed pattern noise (region 1): H-band/ 25 mas scale |
|
| 3 |
o | QC1DB |
MEDIAN |
0.192 |
ADU |
VAL | 0.1,0.25 |
105 |
qc_lflat_fpn1 |
this |
last_yr |
all
|
fixed pattern noise (region 1): K-band ALL camera scales
(this FULL data set is scored) |
| 3 |
• | QC1DB |
none |
|
ADU |
none | |
46 |
qc_lflat_fpn1 |
this |
last_yr |
all
|
fixed pattern noise (region 1): K-band at the 250 mas camera scale |
| 3 |
• | QC1DB |
none |
|
ADU |
none | |
28 |
qc_lflat_fpn1 |
this |
last_yr |
all
|
fixed pattern noise (region 1): K-band at the 100 mas camera scale |
| 3 |
• | QC1DB |
none |
|
ADU |
none | |
31 |
qc_lflat_fpn1 |
this |
last_yr |
all
|
fixed pattern noise (region 1): K-band at the 25 mas camera scale |
|
| 4 |
o | QC1DB |
MEDIAN |
0.195 |
ADU |
35% | ± 0.0683 |
77 |
qc_lflat_fpn1 |
this |
last_yr |
all
|
fixed pattern noise (region 1): H+K-band ALL camera scales
(this FULL data set is scored) |
| 4 |
• | QC1DB |
none |
|
ADU |
none | |
30 |
qc_lflat_fpn1 |
this |
last_yr |
all
|
fixed pattern noise (region 1): H+K-band at the 250 mas camera scale |
| 4 |
• | QC1DB |
none |
|
ADU |
none | |
20 |
qc_lflat_fpn1 |
this |
last_yr |
all
|
fixed pattern noise (region 1): H+K-band at the 100 mas camera scale |
| 4 |
• | QC1DB |
none |
|
ADU |
none | |
27 |
qc_lflat_fpn1 |
this |
last_yr |
all
|
fixed pattern noise (region 1): H+K-band at the 25 mas camera scale |
| |
|
*Data sources: QC1DB: QC1 database; LOCAL: local data source
|
