|
|
 |
|
|
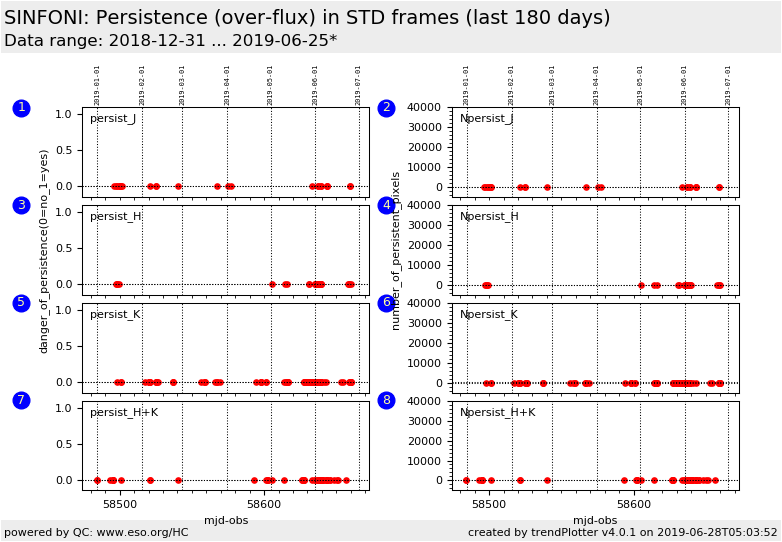
| SINFONI trending system: HEALTH CHECK report |
|
|
| Last update: 2019-06-28T05:04:00 (UT)
|
|
|
|
|
| General news: |
NOTE: The Health Check and calChecker services have been moved to qcFlow. These pages are only maintained for comparison
and will be removed in 2026.
|
|
SINFONI news:
|
2019-06-26: SINFONI taken out of operations
|
Report news:

|
|
|
|
|
|
|

|
|
|
Plot
? |
Symb
? |
Source
* |
Average ? |
Thresholds ? |
N_
data |
QC1
parameter |
Data
downloads |
Remarks |
| method |
value |
unit |
method |
value |
| 1 |
• | QC1DB |
none |
|
unitless |
VAL | 0.0,0.001 |
25 |
qc_persist_danger |
this |
last_yr |
all
|
testing if source flux levels are too high (>10,000 ADU). Danger of persistence = 1; no persistence = 0 (J-band at all camera scales) |
| 2 |
• | QC1DB |
none |
|
number |
VAL | 0.0,100 |
25 |
qc_Npersist |
this |
last_yr |
all
|
if a danger of persistence exists, the total number of affected pixels is computed (J-band) |
|
| 3 |
• | QC1DB |
none |
|
unitless |
VAL | 0.0,0.001 |
31 |
qc_persist_danger |
this |
last_yr |
all
|
testing if source flux levels are too high (>10,000 ADU). Danger of persistence = 1; no persistence = 0 (H-band at all camera scales) |
| 4 |
• | QC1DB |
none |
|
number |
VAL | 0.0,100 |
31 |
qc_Npersist |
this |
last_yr |
all
|
if a danger of persistence exists, the total number of affected pixels is computed (H-band) |
|
| 5 |
• | QC1DB |
none |
|
unitless |
VAL | 0.0,0.001 |
81 |
qc_persist_danger |
this |
last_yr |
all
|
testing if source flux levels are too high (>10,000 ADU). Danger of persistence = 1; no persistence = 0 (K-band at all camera scales) |
| 6 |
• | QC1DB |
none |
|
number |
VAL | 0.0,100 |
81 |
qc_Npersist |
this |
last_yr |
all
|
if a danger of persistence exists, the total number of affected pixels is computed (K-band) |
|
| 7 |
• | QC1DB |
none |
|
unitless |
VAL | 0.0,0.001 |
48 |
qc_persist_danger |
this |
last_yr |
all
|
testing if source flux levels are too high (>10,000 ADU). Danger of persistence = 1; no persistence = 0 (H+K-band at all camera scales) |
| 8 |
• | QC1DB |
none |
|
number |
VAL | 0.0,100 |
48 |
qc_Npersist |
this |
last_yr |
all
|
if a danger of persistence exists, the total number of affected pixels is computed (H+K-band) |
|
| |
|
*Data sources: QC1DB: QC1 database; LOCAL: local data source
|
Plot 1
scores:  2| 2|
| | data source: | sinfoni_std
(QC1 database) |
| dataset: | qc_persist_danger | • |
| average: | none |
| fixed thresholds: | 0.0...0.001 | unitless |
| N_data plotted: | 25 |
| [click plot for closeup] |
Plot 2
scores: 2|
| | data source: | sinfoni_std
(QC1 database) |
| dataset: | qc_Npersist | • |
| average: | none |
| fixed thresholds: | 0.0...100 | number |
| N_data plotted: | 25 |
| [click plot for closeup] |
Plot 3
scores: 4|
| | data source: | sinfoni_std
(QC1 database) |
| dataset: | qc_persist_danger | • |
| average: | none |
| fixed thresholds: | 0.0...0.001 | unitless |
| N_data plotted: | 31 |
| [click plot for closeup] |
Plot 4
scores: 4|
| | data source: | sinfoni_std
(QC1 database) |
| dataset: | qc_Npersist | • |
| average: | none |
| fixed thresholds: | 0.0...100 | number |
| N_data plotted: | 31 |
| [click plot for closeup] |
Plot 5
scores: 10|
| | data source: | sinfoni_std
(QC1 database) |
| dataset: | qc_persist_danger | • |
| average: | none |
| fixed thresholds: | 0.0...0.001 | unitless |
| N_data plotted: | 81 |
| [click plot for closeup] |
Plot 6
scores: 10|
| | data source: | sinfoni_std
(QC1 database) |
| dataset: | qc_Npersist | • |
| average: | none |
| fixed thresholds: | 0.0...100 | number |
| N_data plotted: | 81 |
| [click plot for closeup] |
Plot 7
scores: 3|
| | data source: | sinfoni_std
(QC1 database) |
| dataset: | qc_persist_danger | • |
| average: | none |
| fixed thresholds: | 0.0...0.001 | unitless |
| N_data plotted: | 48 |
| [click plot for closeup] |
Plot 8
scores: 3|
| | data source: | sinfoni_std
(QC1 database) |
| dataset: | qc_Npersist | • |
| average: | none |
| fixed thresholds: | 0.0...100 | number |
| N_data plotted: | 48 |
| [click plot for closeup] |
Click on any of the plots to see a close-up version.
The latest date is indicated on top of the plot.
If configured,
- data points belonging to the latest date are specially marked
- statistical averages are indicated by a solid line, and thresholds by broken lines
- outliers are marked by a red asterisk. They are defined as data points outside the
threshold lines
- "aliens" (= data points outside the plot Y limits) are marked by a red arrow (↑ or ↓)
- you can download the data for each parameter set if the 'Data downloads' link shows up
|
|
|