Plot
? |
Symb
? |
Source
* |
Average ? |
Thresholds ? |
N_
data |
QC1
parameter |
Data
downloads |
Remarks |
| method |
value |
unit |
method |
value |
| 1 |
o | QC1DB |
MEDIAN |
35.2 |
ADU |
VAL | 2.5,300.0 |
31 |
qc_net_flux |
this |
last_yr |
all
|
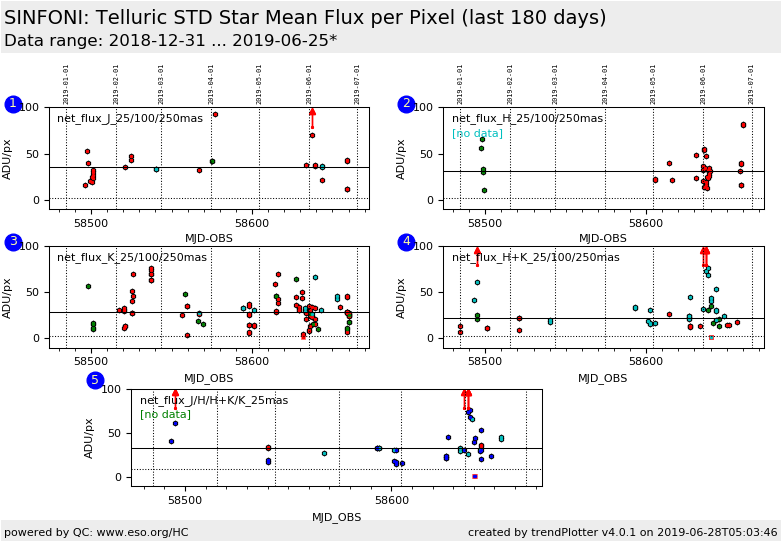
mean flux per pixel within a 3 sigma aperture in the J-band at all camera scales (ADU)
(this FULL data set is scored) |
| 1 |
• | QC1DB |
none |
|
ADU |
none | |
25 |
qc_net_flux |
this |
last_yr |
all
|
mean flux per pixel within a 3 sigma aperture: J-band/250 mas scale |
| 1 |
• | QC1DB |
none |
|
ADU |
none | |
2 |
qc_net_flux |
this |
last_yr |
all
|
mean flux per pixel within a 3 sigma aperture: J-band/100 mas scale |
| 1 |
• | QC1DB |
none |
|
ADU |
none | |
4 |
qc_net_flux |
this |
last_yr |
all
|
mean flux per pixel within a 3 sigma aperture: J-band/25 mas scale |
|
| 2 |
o | QC1DB |
MEDIAN |
31.1 |
ADU |
VAL | 2.5,300.0 |
36 |
qc_net_flux |
this |
last_yr |
all
|
mean flux per pixel within a 3 sigma aperture in the H-band at all camera scales (ADU)
(this FULL data set is scored) |
| 2 |
• | QC1DB |
none |
|
ADU |
none | |
31 |
qc_net_flux |
this |
last_yr |
all
|
mean flux per pixel within a 3 sigma aperture: H-band/250 mas scale |
| 2 |
• | QC1DB |
none |
|
ADU |
none | |
5 |
qc_net_flux |
this |
last_yr |
all
|
mean flux per pixel within a 3 sigma aperture: H-band/100 mas scale |
| 2 |
• | QC1DB |
none |
|
ADU |
none | |
0 |
qc_net_flux |
this |
last_yr |
all
|
mean flux per pixel within a 3 sigma aperture: H-band/25 mas scale |
|
| 3 |
o | QC1DB |
MEDIAN |
28.4 |
ADU |
VAL | 2.5,300.0 |
106 |
qc_net_flux |
this |
last_yr |
all
|
mean flux per pixel within a 3 sigma aperture in the K-band at all camera scales (ADU)
(this FULL data set is scored) |
| 3 |
• | QC1DB |
none |
|
ADU |
none | |
75 |
qc_net_flux |
this |
last_yr |
all
|
mean flux per pixel within a 3 sigma aperture: K-band/250 mas scale |
| 3 |
• | QC1DB |
none |
|
ADU |
none | |
20 |
qc_net_flux |
this |
last_yr |
all
|
mean flux per pixel within a 3 sigma aperture: K-band/100 mas scale |
| 3 |
• | QC1DB |
none |
|
ADU |
none | |
11 |
qc_net_flux |
this |
last_yr |
all
|
mean flux per pixel within a 3 sigma aperture: K-band/25 mas scale |
|
| 4 |
o | QC1DB |
MEDIAN |
22 |
ADU |
VAL | 2.5,300.0 |
55 |
qc_net_flux |
this |
last_yr |
all
|
mean flux per pixel within a 3 sigma aperture in the H+K-band at all camera scales (ADU)
(this FULL data set is scored) |
| 4 |
• | QC1DB |
none |
|
ADU |
none | |
15 |
qc_net_flux |
this |
last_yr |
all
|
mean flux per pixel within a 3 sigma aperture: H+K-band/250 mas scale |
| 4 |
• | QC1DB |
none |
|
ADU |
none | |
7 |
qc_net_flux |
this |
last_yr |
all
|
mean flux per pixel within a 3 sigma aperture: H+K-band/100 mas scale |
| 4 |
• | QC1DB |
none |
|
ADU |
none | |
33 |
qc_net_flux |
this |
last_yr |
all
|
mean flux per pixel within a 3 sigma aperture: H+K-band/25 mas scale |
|
| 5 |
o | QC1DB |
MEDIAN |
32.6 |
ADU |
VAL | 10,300 |
48 |
qc_net_flux |
this |
last_yr |
all
|
mean flux per pixel within a 3 sigma aperture: any Band, 25mas scale |
| 5 |
• | QC1DB |
none |
|
ADU |
none | |
4 |
qc_net_flux |
this |
last_yr |
all
|
mean flux per pixel within a 3 sigma aperture: J-band/25 mas scale |
| 5 |
• | QC1DB |
none |
|
ADU |
none | |
0 |
qc_net_flux |
this |
last_yr |
all
|
mean flux per pixel within a 3 sigma aperture: H-band/25 mas scale |
| 5 |
• | QC1DB |
none |
|
ADU |
none | |
11 |
qc_net_flux |
this |
last_yr |
all
|
mean flux per pixel within a 3 sigma aperture: K-band/25 mas scale |
| 5 |
• | QC1DB |
none |
|
ADU |
none | |
33 |
qc_net_flux |
this |
last_yr |
all
|
mean flux per pixel within a 3 sigma aperture: H+K-band/25 mas scale |
| |
|
*Data sources: QC1DB: QC1 database; LOCAL: local data source
|
