Plot
? |
Symb
? |
Source
* |
Average ? |
Thresholds ? |
N_
data |
QC1
parameter |
Data
downloads |
Remarks |
| method |
value |
unit |
method |
value |
| 1 |
o | QC1DB |
MEDIAN |
1.25 |
microns |
0.015% | ± 0.000188 |
71 |
qc_coef0_med |
this |
last_yr |
all
|
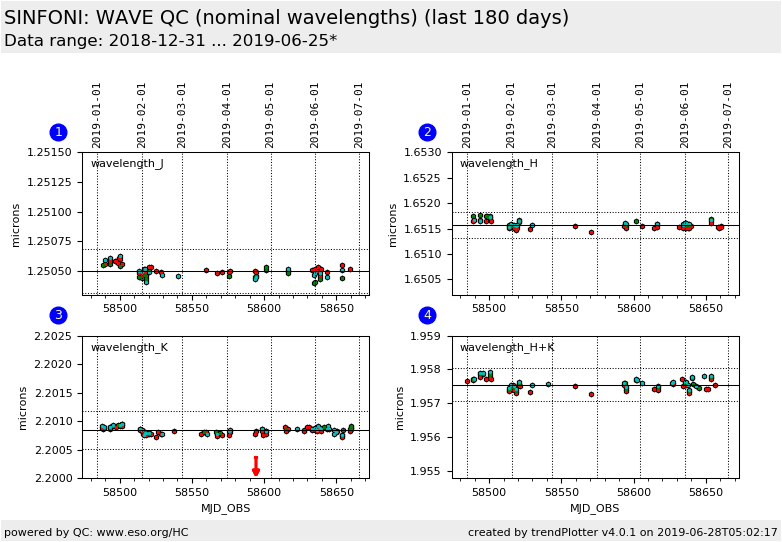
nominal wavelength in the J-band at ALL camera scales
(this FULL data set is scored) |
| 1 |
• | QC1DB |
none |
|
microns |
none | |
35 |
qc_coef0_med |
this |
last_yr |
all
|
nominal wavelength: J-band/250 mas scale ETC: 1071 to 1378, central 1225 |
| 1 |
• | QC1DB |
none |
|
microns |
none | |
18 |
qc_coef0_med |
this |
last_yr |
all
|
nominal wavelength: J-band/100 mas scale |
| 1 |
• | QC1DB |
none |
|
microns |
none | |
18 |
qc_coef0_med |
this |
last_yr |
all
|
nominal wavelength: J-band/25 mas scale |
|
| 2 |
o | QC1DB |
MEDIAN |
1.65 |
microns |
0.015% | ± 0.000248 |
73 |
qc_coef0_med |
this |
last_yr |
all
|
nominal wavelength in the H-band at ALL camera scales
(this FULL data set is scored) |
| 2 |
• | QC1DB |
none |
|
microns |
none | |
34 |
qc_coef0_med |
this |
last_yr |
all
|
nominal wavelength: H-band/250 mas scale ETC: 1470 to 1879, central 1675 |
| 2 |
• | QC1DB |
none |
|
microns |
none | |
21 |
qc_coef0_med |
this |
last_yr |
all
|
nominal wavelength: H-band/100 mas scale |
| 2 |
• | QC1DB |
none |
|
microns |
none | |
18 |
qc_coef0_med |
this |
last_yr |
all
|
nominal wavelength: H-band/25 mas scale |
|
| 3 |
o | QC1DB |
MEDIAN |
2.2 |
microns |
0.015% | ± 0.00033 |
112 |
qc_coef0_med |
this |
last_yr |
all
|
nominal wavelength in the K-band at ALL camera scales
(this FULL data set is scored) |
| 3 |
• | QC1DB |
none |
|
microns |
none | |
47 |
qc_coef0_med |
this |
last_yr |
all
|
nominal wavelength: K-band/250 mas scale ETC: 1919 to 2431, central 2175 |
| 3 |
• | QC1DB |
none |
|
microns |
none | |
28 |
qc_coef0_med |
this |
last_yr |
all
|
nominal wavelength: K-band/100 mas scale |
| 3 |
• | QC1DB |
none |
|
microns |
none | |
37 |
qc_coef0_med |
this |
last_yr |
all
|
nominal wavelength: K-band/25 mas scale |
|
| 4 |
o | QC1DB |
MEDIAN |
1.96 |
microns |
0.025% | ± 0.000489 |
78 |
qc_coef0_med |
this |
last_yr |
all
|
nominal wavelength in the H+K-band at ALL camera scales
(this FULL data set is scored) |
| 4 |
• | QC1DB |
none |
|
microns |
none | |
31 |
qc_coef0_med |
this |
last_yr |
all
|
nominal wavelength: H+K-band/250 mas scale ETC: 1438 to 2462, central 1952 |
| 4 |
• | QC1DB |
none |
|
microns |
none | |
20 |
qc_coef0_med |
this |
last_yr |
all
|
nominal wavelength: H+K-band/100 mas scale |
| 4 |
• | QC1DB |
none |
|
microns |
none | |
27 |
qc_coef0_med |
this |
last_yr |
all
|
nominal wavelength: H+K-band/25 mas scale |
|
| |
|
*Data sources: QC1DB: QC1 database; LOCAL: local data source
|
