Plot
? |
Symb
? |
Source
* |
Average ? |
Thresholds ? |
N_
data |
QC1
parameter |
Data
downloads |
Remarks |
| method |
value |
unit |
method |
value |
| 1 |
• | QC1DB |
MEDIAN |
|
NONE |
none | |
0 |
resol_med |
this |
last_yr |
all
|
REDL 564.0nm 1x1 0.8arcs slit |
| 1 |
• | QC1DB |
MEDIAN |
48.7 |
NONE |
none | |
68 |
resol_med |
this |
last_yr |
all
|
REDL 564.0nm 1x1 1.0arcs slit |
| 2 |
• | QC1DB |
MEDIAN |
113 |
NONE |
none | |
344 |
resol_med |
this |
last_yr |
all
|
REDL 580.0nm 1x1 0.3arcs slit |
| 2 |
• | QC1DB |
MEDIAN |
49.1 |
NONE |
none | |
180 |
resol_med |
this |
last_yr |
all
|
REDL 580.0nm 1x1 1.0arcs slit |
| 3 |
• | QC1DB |
MEDIAN |
|
NONE |
none | |
0 |
resol_med |
this |
last_yr |
all
|
REDL 760.0nm 1x1 0.3arcs slit |
| 3 |
• | QC1DB |
MEDIAN |
47.3 |
NONE |
none | |
60 |
resol_med |
this |
last_yr |
all
|
REDL 760.0nm 1x1 1.0arcs slit |
| 4 |
• | QC1DB |
MEDIAN |
|
NONE |
none | |
0 |
resol_med |
this |
last_yr |
all
|
REDL 860.0nm 1x1 0.8arcs slit |
| 4 |
• | QC1DB |
MEDIAN |
47.3 |
NONE |
none | |
48 |
resol_med |
this |
last_yr |
all
|
REDL 860.0nm 1x1 1.0arcs slit |
| 5 |
• | QC1DB |
MEDIAN |
|
NONE |
none | |
0 |
fwhm_med |
this |
last_yr |
all
|
REDL 564.0nm 1x1 0.8arcs slit |
| 5 |
• | QC1DB |
MEDIAN |
5.35 |
NONE |
none | |
63 |
fwhm_med |
this |
last_yr |
all
|
REDL 564.0nm 1x1 1.0arcs slit |
| 6 |
• | QC1DB |
MEDIAN |
2.2 |
NONE |
none | |
325 |
fwhm_med |
this |
last_yr |
all
|
REDL 580.0nm 1x1 0.3arcs slit |
| 6 |
• | QC1DB |
MEDIAN |
5.34 |
NONE |
none | |
173 |
fwhm_med |
this |
last_yr |
all
|
REDL 580.0nm 1x1 1.0arcs slit |
| 7 |
• | QC1DB |
MEDIAN |
|
NONE |
none | |
0 |
fwhm_med |
this |
last_yr |
all
|
REDL 760.0nm 1x1 0.3arcs slit |
| 7 |
• | QC1DB |
MEDIAN |
5.51 |
NONE |
none | |
59 |
fwhm_med |
this |
last_yr |
all
|
REDL 760.0nm 1x1 1.0arcs slit |
| 8 |
• | QC1DB |
MEDIAN |
|
NONE |
none | |
0 |
fwhm_med |
this |
last_yr |
all
|
REDL 860.0nm 1x1 0.8arcs slit |
| 8 |
• | QC1DB |
MEDIAN |
5.5 |
NONE |
none | |
48 |
fwhm_med |
this |
last_yr |
all
|
REDL 860.0nm 1x1 1.0arcs slit |
| 9 |
+ | QC1DB |
none |
|
NONE |
none | |
148 |
resol_med |
this |
last_yr |
all
|
REDL 564.0nm 1x1 all slit width |
| 10 |
+ | QC1DB |
none |
|
NONE |
none | |
900 |
resol_med |
this |
last_yr |
all
|
REDL 580.0nm 1x1 all slit width |
| 11 |
+ | QC1DB |
none |
|
NONE |
none | |
76 |
resol_med |
this |
last_yr |
all
|
REDL 760.0nm 1x1& all slit width& |
| 12 |
+ | QC1DB |
none |
|
NONE |
none | |
106 |
resol_med |
this |
last_yr |
all
|
REDL 860.0nm 1x1& all slit width& |
| |
|
*Data sources: QC1DB: QC1 database; LOCAL: local data source
|
Plot 1
scores: not implemented
| | data source: | uves_wave
(QC1 database) |
dataset:
(numbers below apply to this dataset) | resol_med | • |
| median: | no data | NONE |
| thresholds: | none | |
| N_data plotted: | 0 |
| [click plot for closeup] |
Plot 2
scores: not implemented
| | data source: | uves_wave
(QC1 database) |
dataset:
(numbers below apply to this dataset) | resol_med | • |
| median: | 113 | NONE |
| thresholds: | none | |
| N_data plotted: | 344 |
| [click plot for closeup] |
Plot 3
scores: not implemented
| | data source: | uves_wave
(QC1 database) |
dataset:
(numbers below apply to this dataset) | resol_med | • |
| median: | no data | NONE |
| thresholds: | none | |
| N_data plotted: | 0 |
| [click plot for closeup] |
Plot 4
scores: not implemented
| | data source: | uves_wave
(QC1 database) |
dataset:
(numbers below apply to this dataset) | resol_med | • |
| median: | no data | NONE |
| thresholds: | none | |
| N_data plotted: | 0 |
| [click plot for closeup] |
Plot 5
scores: not implemented
| | data source: | uves_wave
(QC1 database) |
dataset:
(numbers below apply to this dataset) | fwhm_med | • |
| median: | no data | NONE |
| thresholds: | none | |
| N_data plotted: | 0 |
| [click plot for closeup] |
Plot 6
scores: not implemented
| | data source: | uves_wave
(QC1 database) |
dataset:
(numbers below apply to this dataset) | fwhm_med | • |
| median: | 2.2 | NONE |
| thresholds: | none | |
| N_data plotted: | 325 |
| [click plot for closeup] |
Plot 7
scores: not implemented
| | data source: | uves_wave
(QC1 database) |
dataset:
(numbers below apply to this dataset) | fwhm_med | • |
| median: | no data | NONE |
| thresholds: | none | |
| N_data plotted: | 0 |
| [click plot for closeup] |
Plot 8
scores: not implemented
| | data source: | uves_wave
(QC1 database) |
dataset:
(numbers below apply to this dataset) | fwhm_med | • |
| median: | no data | NONE |
| thresholds: | none | |
| N_data plotted: | 0 |
| [click plot for closeup] |
Plot 9
scores: not implemented
| | data source: | uves_wave
(QC1 database) |
| dataset: | resol_med | + |
| average: | none |
| thresholds: | none |
| N_data plotted: | 148 |
| [click plot for closeup] |
Plot 10
scores: not implemented
| | data source: | uves_wave
(QC1 database) |
| dataset: | resol_med | + |
| average: | none |
| thresholds: | none |
| N_data plotted: | 900 |
| [click plot for closeup] |
Plot 11
scores: not implemented
| | data source: | uves_wave
(QC1 database) |
| dataset: | resol_med | + |
| average: | none |
| thresholds: | none |
| N_data plotted: | 76 |
| [click plot for closeup] |
Plot 12
scores: not implemented
| | data source: | uves_wave
(QC1 database) |
| dataset: | resol_med | + |
| average: | none |
| thresholds: | none |
| N_data plotted: | 106 |
| [click plot for closeup] |
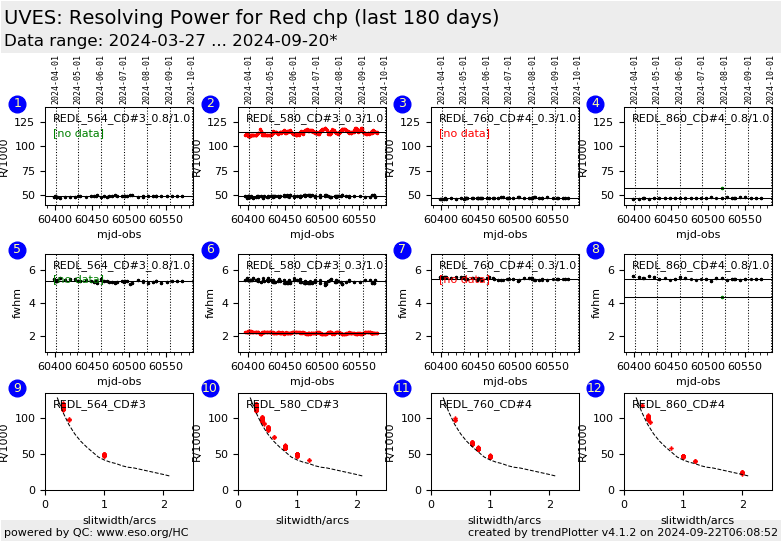
This is the trending report for monitoring UVES Resolution based on QC
parameters derived from wavelength calibration frames (WAVE_ECH).
It trends the measured resolution in the Health
Check calibrations which are taken in one BLUE (437nm) and one RED
(580nm) setting. It also displays a comparison of
measured resolutions to the nominal values.
The lower thresholds of plots 1-3 are set to the nominal expected
resolution. Therefore results below these thresholds should
be investigated closely.
The individual plots describe:
- measured resolution for the REDU or L chip of the 564.0nm, 1x1, 0.8 and 1.0 arcs slits
- measured resolution for the REDU or L chip of the 580.0nm, 1x1, 0.3 and 1.0 arcs slits
- measured resolution for the REDU or L chip of the 760.0nm, 1x1, 0.3 and 1.0 arcs slits
- measured resolution for the REDU or L chip of the 860.0nm, 1x1, 0.8 and 1.0 arcs slits
For these plots the value of the lower threshold is set to the value
given in the user manual. The Upper Chip red lower threshold is set to 95%
because of charge diffusion.
- measured resolution as a function of slit-width for all BLUE 564.0nm, 1x1 data
- measured resolution as a function of slit-width for all REDL 580.0nm, 1x1 data
- measured resolution as a function of slit-width for the REDU 760.0nm, 1x1 data
- measured resolution as a function of slit-width for the REDU 860.0nm, 1x1 data.
For these plots, the green dotted curve is set to 95% of the nominal
resolution (black dotted curve)
The black dotted curve in the plots 4/5/6 follows the values from the User
Manual (see table below).
Find more information about UVES wavelength solution monitoring here.
Note: The Upper chip R is expected to be a bit lower due to charge
diffusion. This was especially true of the old MIT/LL chip, seems to be better
for the new Upper chip.The dotted curves plots 5/6/7/8 gives the "nominal"
resolution (black) and one 5% lower (green).
SLITW R_blue R_red(L) old_R_red(U)
#2.1 20000 20000 19000
#2.0 22000 22000 20900
#1.50 31000 31000 29450
#1.40 32000 32000 30400
#1.30 34000 34000 32300
#1.20 37000 37000 35150
#1.10 39000 39000 37050
#1.00 41000 42000 39900
#0.90 44000 46000 43700
#0.80 50000 53000 50350
#0.70 54000 60000 57000
#0.60 59000 68000 64600
#0.50 65000 78000 74100
#0.40 71000 91000 86450
#0.30 78000 108000 102600
#0.20 82000 129000 122550
General information
Click on any of the plots to see a close-up version.
The latest date is indicated on top of the plot.
If configured,
- data points belonging to the latest date are specially marked
- statistical averages are indicated by a solid line, and thresholds by broken lines
- outliers are marked by a red asterisk. They are defined as data points outside the
threshold lines
- "aliens" (= data points outside the plot Y limits) are marked by a red arrow (↑ or ↓)
- you can download the data for each parameter set if the 'Data downloads' link shows up
|
