Plot
? |
Symb
? |
Source
* |
Average ? |
Thresholds ? |
N_
data |
QC1
parameter |
Data
downloads |
Remarks |
| method |
value |
unit |
method |
value |
| 1 |
• | QC1DB |
MEDIAN |
1.03e+03 |
counts |
none | |
68 |
mean_master |
this |
last_yr |
all
|
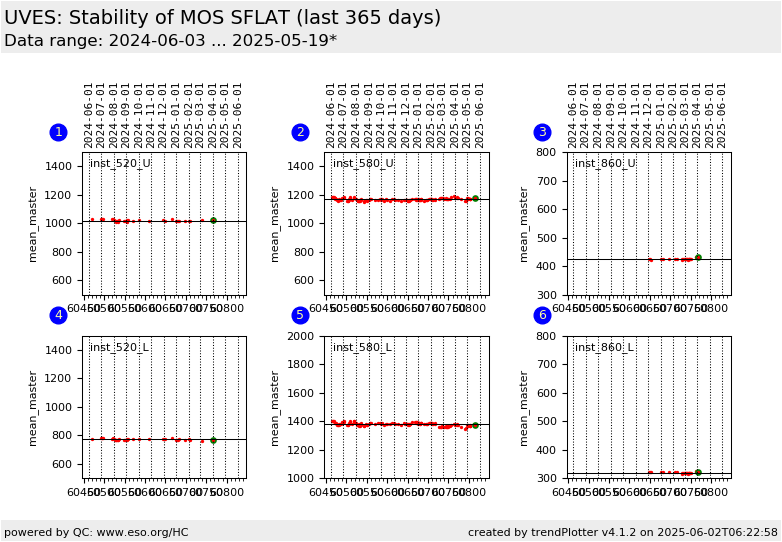
mean_master (from header raw file), from 520.0nm, 1x1, REDU CCD |
| 2 |
• | QC1DB |
MEDIAN |
1.17e+03 |
counts |
none | |
152 |
mean_master |
this |
last_yr |
all
|
mean_master (from header raw file), from 580.0nm, 1x1, REDU CCD |
| 3 |
• | QC1DB |
MEDIAN |
434 |
counts |
none | |
13 |
mean_master |
this |
last_yr |
all
|
mean_master (from header raw file), from 860.0nm, 1x1, REDU CCD |
| 4 |
• | QC1DB |
MEDIAN |
778 |
counts |
none | |
68 |
mean_master |
this |
last_yr |
all
|
mean_master (from header raw file), from 520.0nm, 1x1, REDL CCD |
| 5 |
• | QC1DB |
MEDIAN |
1.4e+03 |
counts |
none | |
152 |
mean_master |
this |
last_yr |
all
|
mean_master (from header raw file), from 580.0nm, 1x1, REDL CCD |
| 6 |
• | QC1DB |
MEDIAN |
330 |
counts |
none | |
13 |
mean_master |
this |
last_yr |
all
|
mean_master (from header raw file), from 860.0nm, 1x1, REDL CCD |
| |
|
*Data sources: QC1DB: QC1 database; LOCAL: local data source
|
Plot 1
scores: not implemented
| | data source: | uves_fib_sflat
(QC1 database) |
| dataset: | mean_master | • |
| median: | 1.03e+03 | counts |
| thresholds: | none | |
| N_data plotted: | 68 |
| [click plot for closeup] |
Plot 2
scores: not implemented
| | data source: | uves_fib_sflat
(QC1 database) |
| dataset: | mean_master | • |
| median: | 1.17e+03 | counts |
| thresholds: | none | |
| N_data plotted: | 152 |
| [click plot for closeup] |
Plot 3
scores: not implemented
| | data source: | uves_fib_sflat
(QC1 database) |
| dataset: | mean_master | • |
| median: | 434 | counts |
| thresholds: | none | |
| N_data plotted: | 13 |
| [click plot for closeup] |
Plot 4
scores: not implemented
| | data source: | uves_fib_sflat
(QC1 database) |
| dataset: | mean_master | • |
| median: | 778 | counts |
| thresholds: | none | |
| N_data plotted: | 68 |
| [click plot for closeup] |
Plot 5
scores: not implemented
| | data source: | uves_fib_sflat
(QC1 database) |
| dataset: | mean_master | • |
| median: | 1.4e+03 | counts |
| thresholds: | none | |
| N_data plotted: | 152 |
| [click plot for closeup] |
Plot 6
scores: not implemented
| | data source: | uves_fib_sflat
(QC1 database) |
| dataset: | mean_master | • |
| median: | 330 | counts |
| thresholds: | none | |
| N_data plotted: | 13 |
| [click plot for closeup] |
Click on any of the plots to see a close-up version.
The latest date is indicated on top of the plot.
If configured,
- data points belonging to the latest date are specially marked
- statistical averages are indicated by a solid line, and thresholds by broken lines
- outliers are marked by a red asterisk. They are defined as data points outside the
threshold lines
- "aliens" (= data points outside the plot Y limits) are marked by a red arrow (↑ or ↓)
- you can download the data for each parameter set if the 'Data downloads' link shows up
|
