XSHOOTER: Telluric and Flux standard stars
| |
| HC PLOTS |
| VIS Signal-to_noise ratio |
 |
| NIR |
|
|
QC1 database (advanced users):
browse |
plot
|
| UVB efficiency |
|
| VIS |
|
| NIR |
|
| UVB response function |
|
| VIS |
|
| NIR |
|
|
QC1 database (advanced users):
browse |
plot
|
Telluric standard stars are processed for the VIS and NIR arm
only. UVB-arm telluric standard star spectra come by free but are not
processed. VIS-arm tellurics might become very bright and expose the CCD
up into the non-linear detector response regime or might even saturate
the chip. For the NIR-arm pixels exposed by more than 42000 ADU switch
from interpolation mode into extrapolation mode.
From the flux standard stars response curves and efficiency measurements
are derived in addition.
 Signal-to-noise ratio
QC1_parameters
| FITS key |
QC1 database: table, name |
definition |
class* |
HC_plot** |
more docu |
| QC.FLUX1.VAL | xshooter_telluric..counts1 | average counts in first region (ADU) | CAL |  | [docuSys coming] |
| QC.FLUX2.VAL | xshooter_telluric..counts2 | average counts in second region (ADU) | CAL | | [docuSys coming] |
| QC.FLUX3.VAL | xshooter_telluric..counts3 | average counts in third region (ADU) | CAL | | [docuSys coming] |
| QC.FLUX1.SN | xshooter_telluric..sn1 | average signal-to-noise ratio in first region | CAL | | [docuSys coming] |
| QC.FLUX2.SN | xshooter_telluric..sn2 | average signal-to-noise ratio in second region | CAL | | [docuSys coming] |
| QC.FLUX3.SN | xshooter_telluric..sn3 | average signal-to-noise ratio in third region | CAL | | [docuSys coming] |
*Class: KPI - instrument performance; HC - instrument health; CAL - calibration quality; ENG - engineering parameter
**There might be more than one. |
Trending
The investigated wavelength regions have been chosen in that way that
the contamination of the signal to noise ratio by telluric absorption
features is minimized in the case of telluric standard stars. The regions
are given (in nm):
| arm | 1 | 2 | 3 |
| UVB | 450-470 | 510-530 | |
| VIS | 627-680 | 745-756 | 992-999 |
| NIR | 1518-1548 | 2214-2243 | |
Scoring&thresholds Signal-to-noise ratio
Signal-to-noise ratio and the counts of standard star observations is a calibration product quality.
It is therefore not scored and not trended. Alone the SN-ratio versus counts relation is plotted.
History
In 2012 and 2013 several new pipeline versions with better handling of the noise introduced a better
SNR-to_counts relation.
Algorithm Signal-to-noise ratio
The signal-to_noise is derived from spectral regions that are not biased by telluric absorption features.
Saturation
QC1_parameters
| FITS key |
QC1 database: table, name |
definition |
class* |
HC_plot** |
more docu |
| QC.FLUX1.VAL | xshooter_telluric..npix_high | (maximum) number of pixels above 60000 ADU (UVB/VIS) in raw frame(s) | CAL | | [docuSys coming] |
| QC.FLUX2.VAL | xshooter_telluric..npix_sat | number of saturated pixels in raw frame(s) | CAL | | [docuSys coming] |
| QC.FLUX3.VAL | xshooter_telluric..fpix_sat | fraction of saturated pixels in raw frame(s) | CAL | | [docuSys coming] |
*Class: KPI - instrument performance; HC - instrument health; CAL - calibration quality; ENG - engineering parameter
**There might be more than one. |
Trending
- npix_high
gives the maximum number of highly exposed pixels (>60000 ADU for UVB/VIS) in the raw data. These pixels are not saturated but very likely significantly non-linear in their response.
- npix_sat
gives the number of saturated pixels (65535 ADU for UVB/VIS, 0 for NIR) in the raw data. The correct implementation for NIR data has been done only from version 0.9.8 on, but unfortunately also unsaturated pixels may have a flux of 0 or less in NIR raw data.
- fpix_sat
gives the fraction of saturated pixels (65535 ADU for UVB/VIS, 0 for NIR) in the raw data. The correct implementation for NIR data has been done only from version 0.9.8 on, but unfortunately also unsaturated pixels may have a flux of 0 or less in NIR raw data.
The detector response non-linearity at saturation level (65535 ADU) has
been retrieved from detector monitoring data from 2103-06-13 within a
small analysis window of 100x100 pixels ( [x=1500-1600 : y=1700-1800])
with homogeneous flat lamp illumination to be:
| arm | 400k 1x1 | 100k 1x1 |
| UVB | 0.028 | 0.0016 |
| VIS | 0.002 | 0.0049 |
Scoring&thresholds Saturation
The QC parameters are not trended and not scored
History
No remarks.
Algorithm Saturation
The QC parameter is derived from simple pixel counting and filtering by thresholds.
Efficiency (for flux standard stars only)
QC1_parameters
| FITS key |
QC1 database: table, name |
definition |
class* |
HC_plot** |
more docu |
| QC.EFF1 | xshooter_fluxeff..eff1 | mean efficiency in first wavelength region | HC | | [docuSys coming] |
| QC.EFF2 | xshooter_fluxeff..eff2 | mean efficiency in second wavelength region | HC | | [docuSys coming] |
| QC.EFF3 | xshooter_fluxeff..eff3 | mean efficiency in third wavelength region | HC | | [docuSys coming] |
| QC.PEAK_EFF_1 | xshooter_fluxeff..peak_eff1 | | HC | | [docuSys coming] |
| QC.MED_EFF_1 | xshooter_fluxeff..med_eff1 | | HC | | [docuSys coming] |
*Class: KPI - instrument performance; HC - instrument health; CAL - calibration quality; ENG - engineering parameter
**There might be more than one. |
Trending
- eff1, eff2, eff3 gives the average efficiency over the i'th wavelength range specified by start and end,
see e.g. upper left box of EFF_VIS
- peak_eff_i gives the maximum efficiency in order i.
- med_eff_i gives the median efficiency in order i. Values of all orders are combined to build a chromatic efficiency plot,
see e.g. lower left box of chromatic efficiency UVB
Scoring&thresholds Efficiency (for flux standard stars only)
The QC parameters are not scored
History
The processing of flux standard stars are been improved since 2013-06. The improvements include:
- Spectrophotometric reference spectra are based on model atmospheres
- For the VIS and NIR-arm the observed flux standard star spectrum is corrected for telluric absorption to improve the stability and quality of the spline fit.
- The smoothing of the ratio spectrum (the response function) is no longer performed by a masking technique but by a grid point technique.
Algorithm Efficiency (for flux standard stars only)
For each spectral order the reference spectrum is fit to the observed spectrum. The intensity scaling factor is the efficiency.
Response function (for flux standard stars only)
While the efficiency is a technical parameter being independent on
the flat field lamp, (the efficiency as a function of wavelength
shows the blaze function), the response function is a flat
fielded product being dependent on the lamp spectrum. The
response function is parameterized and monitored in the same way as the
flat lamp spectra. The flux standard star acquired in 2015-10-24
and the resulting response function serves as a reference response
function to which the response function being derived from the nearly
daily acquired flux standard star is compared with.
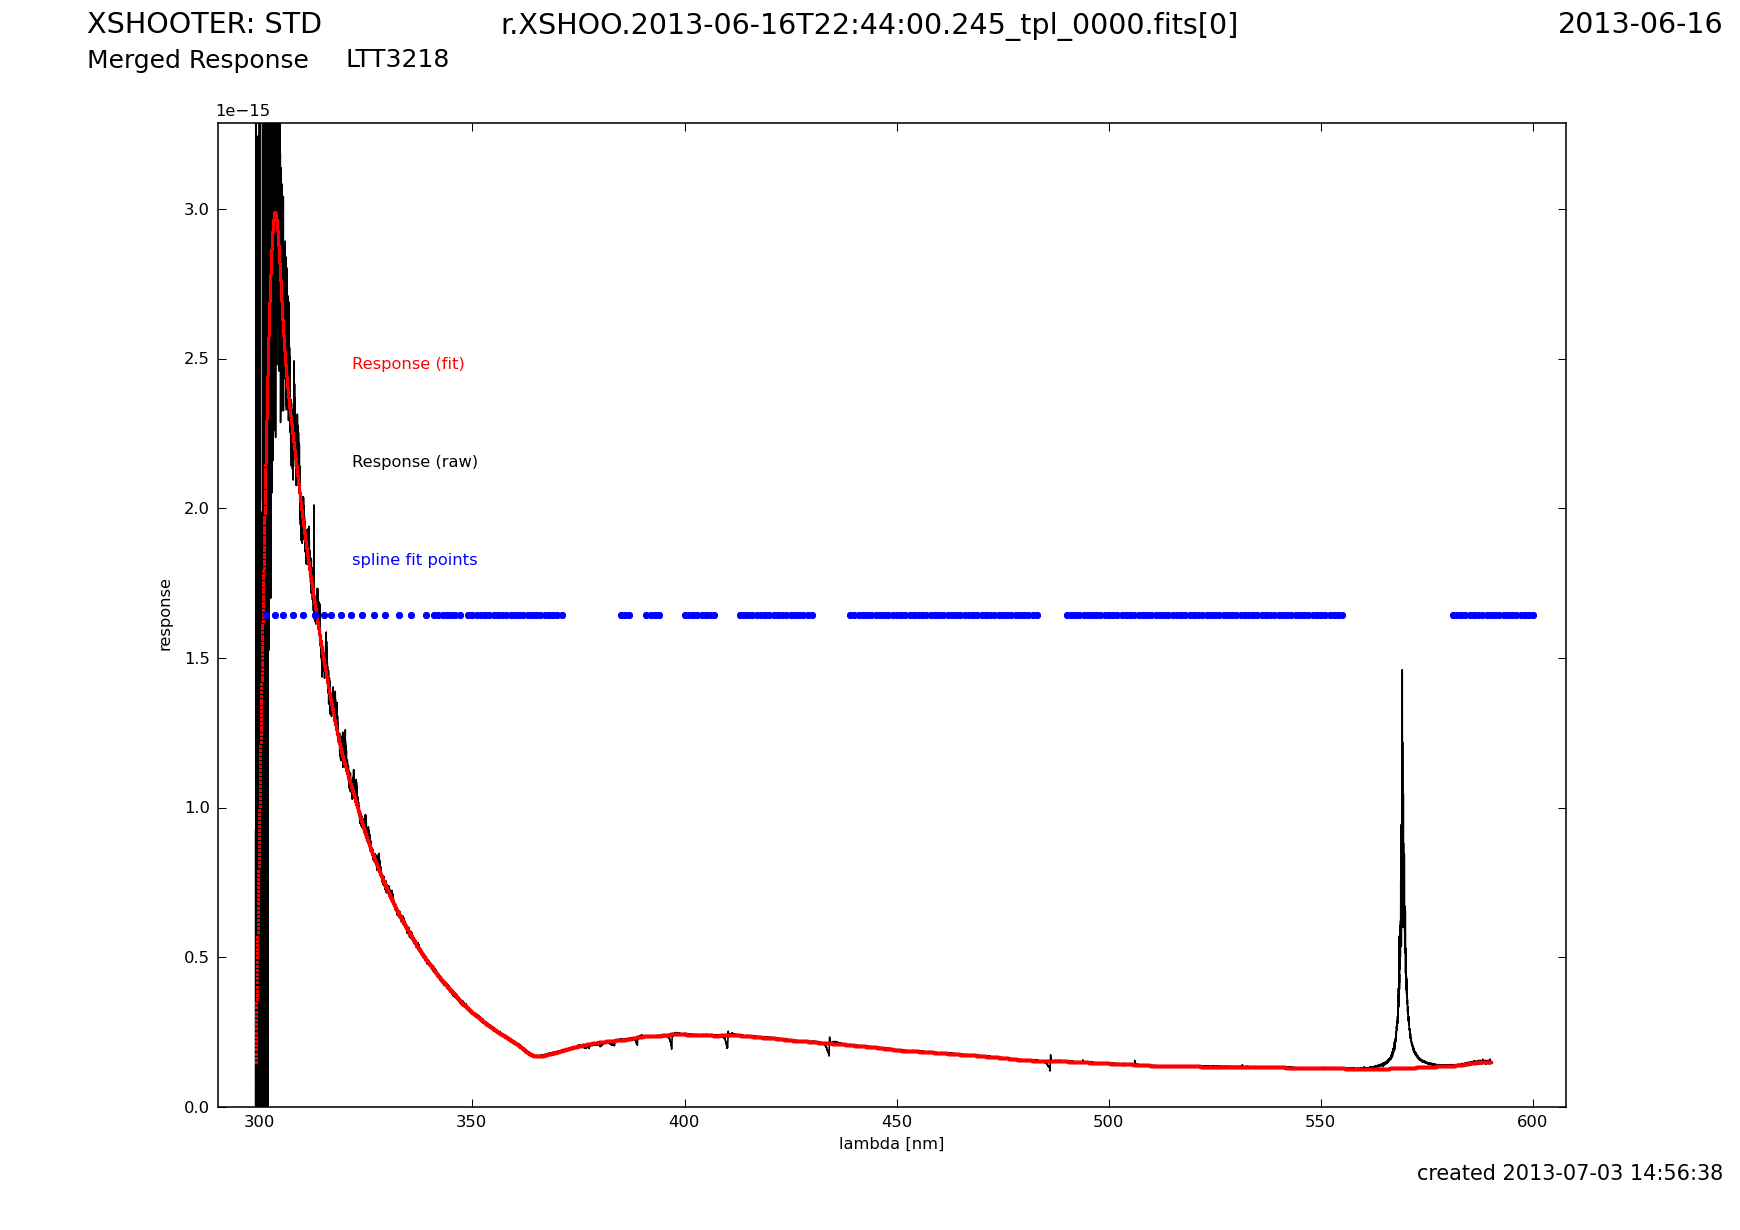
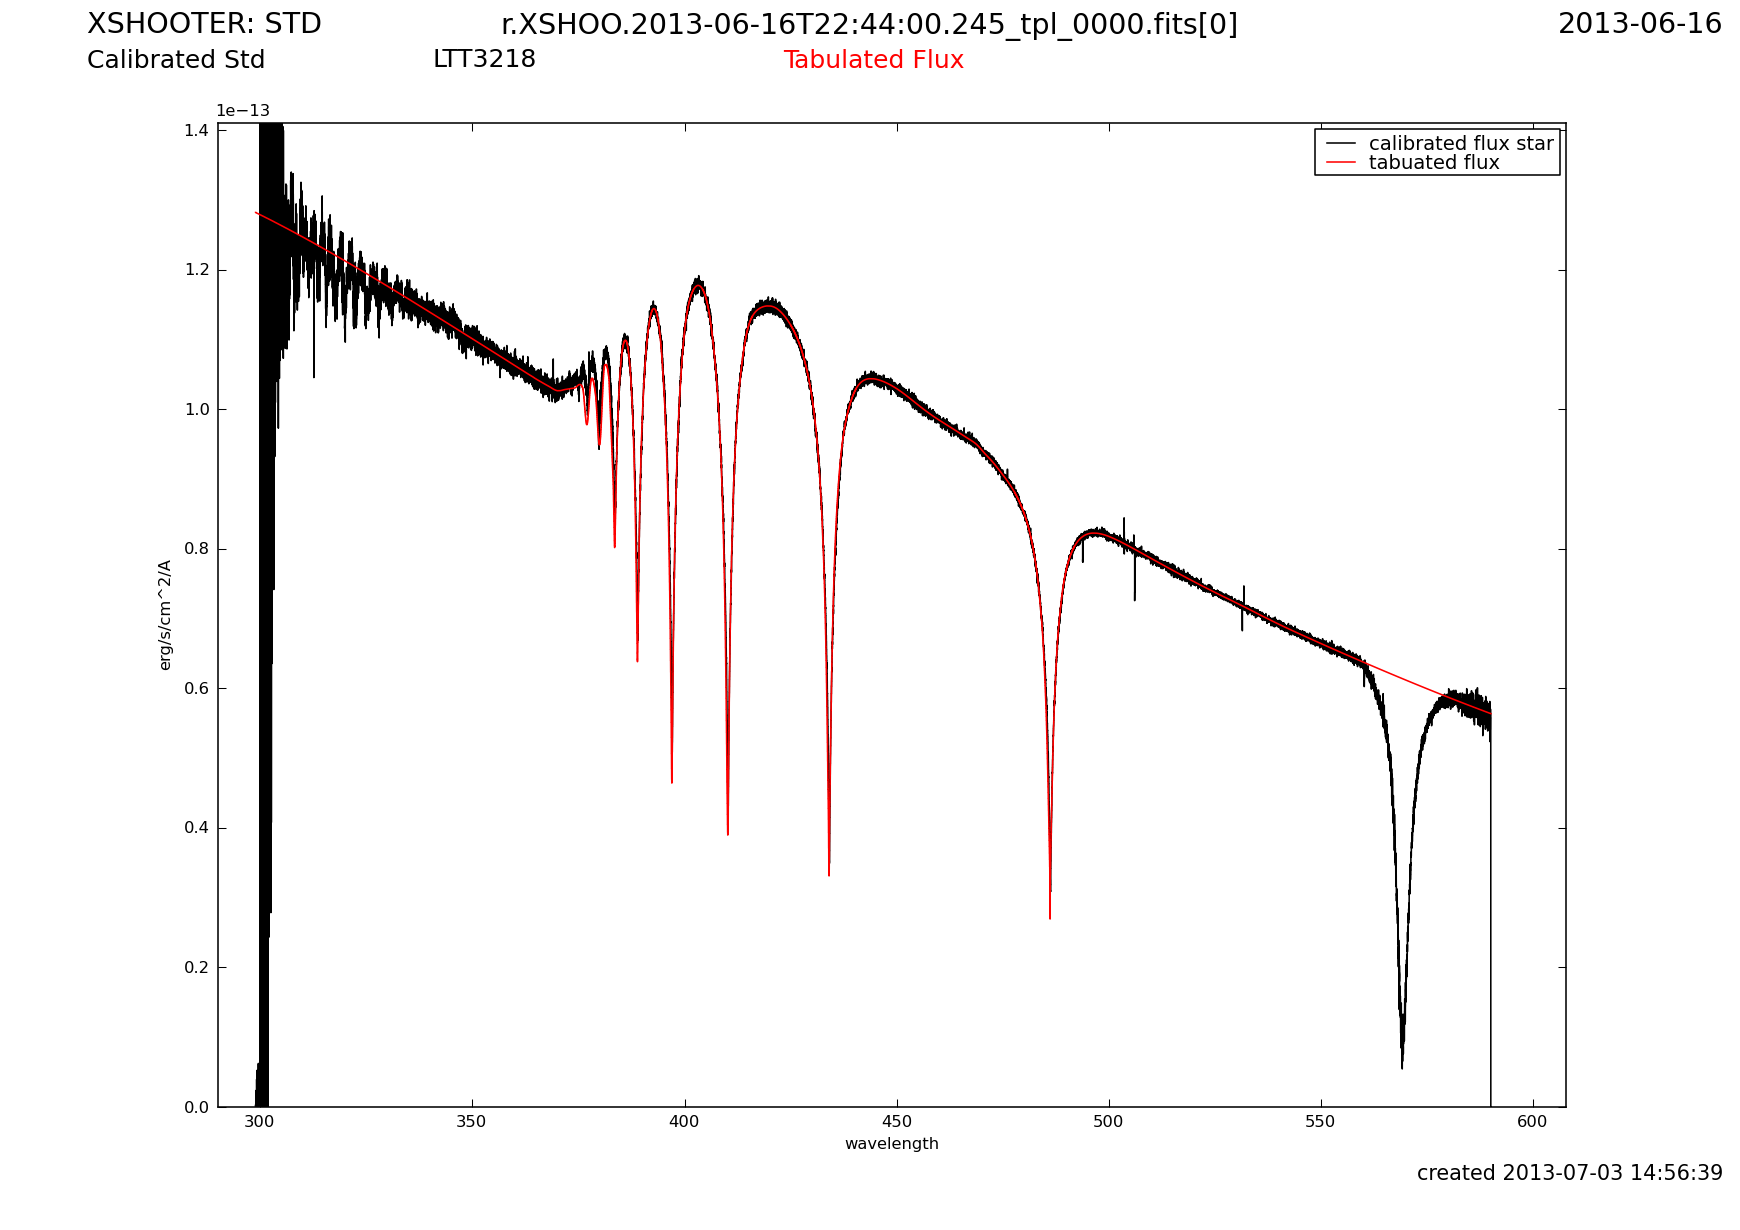
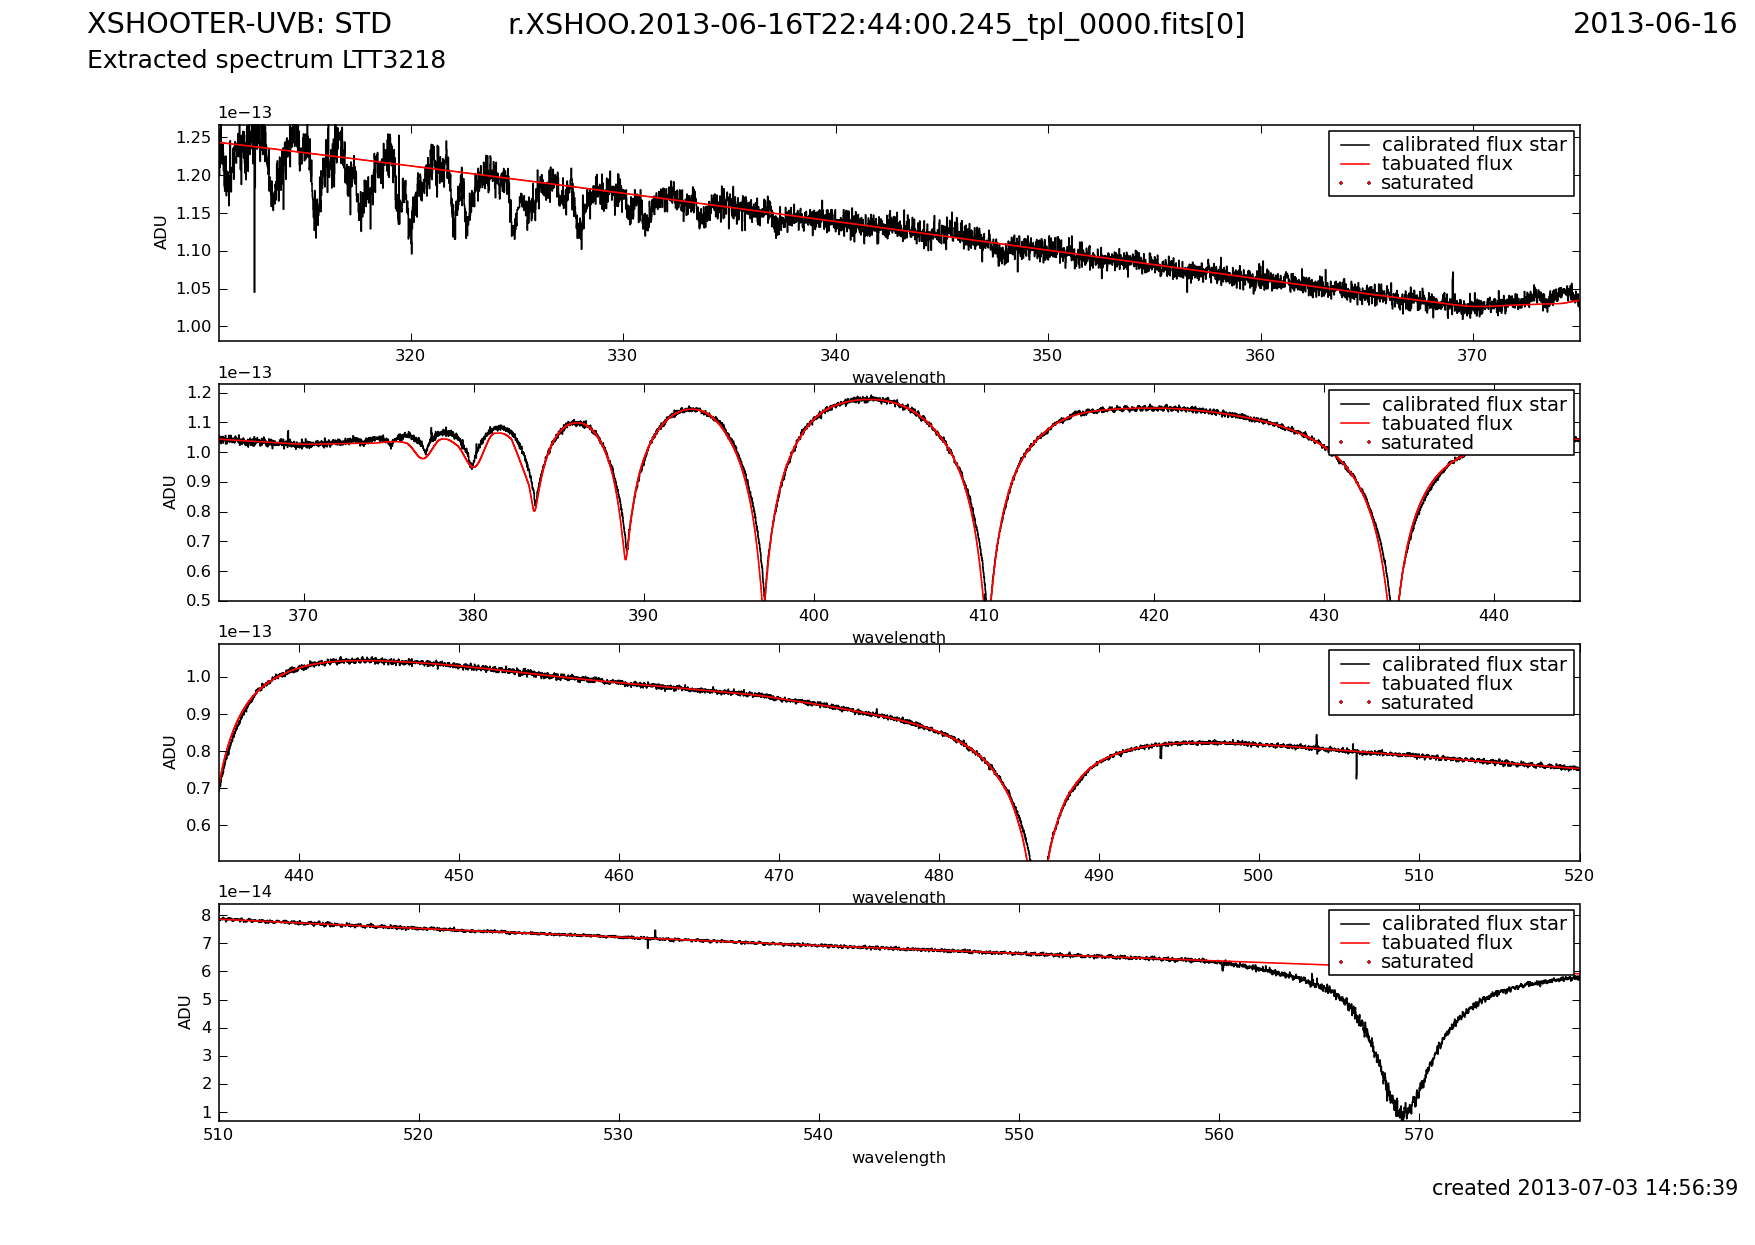
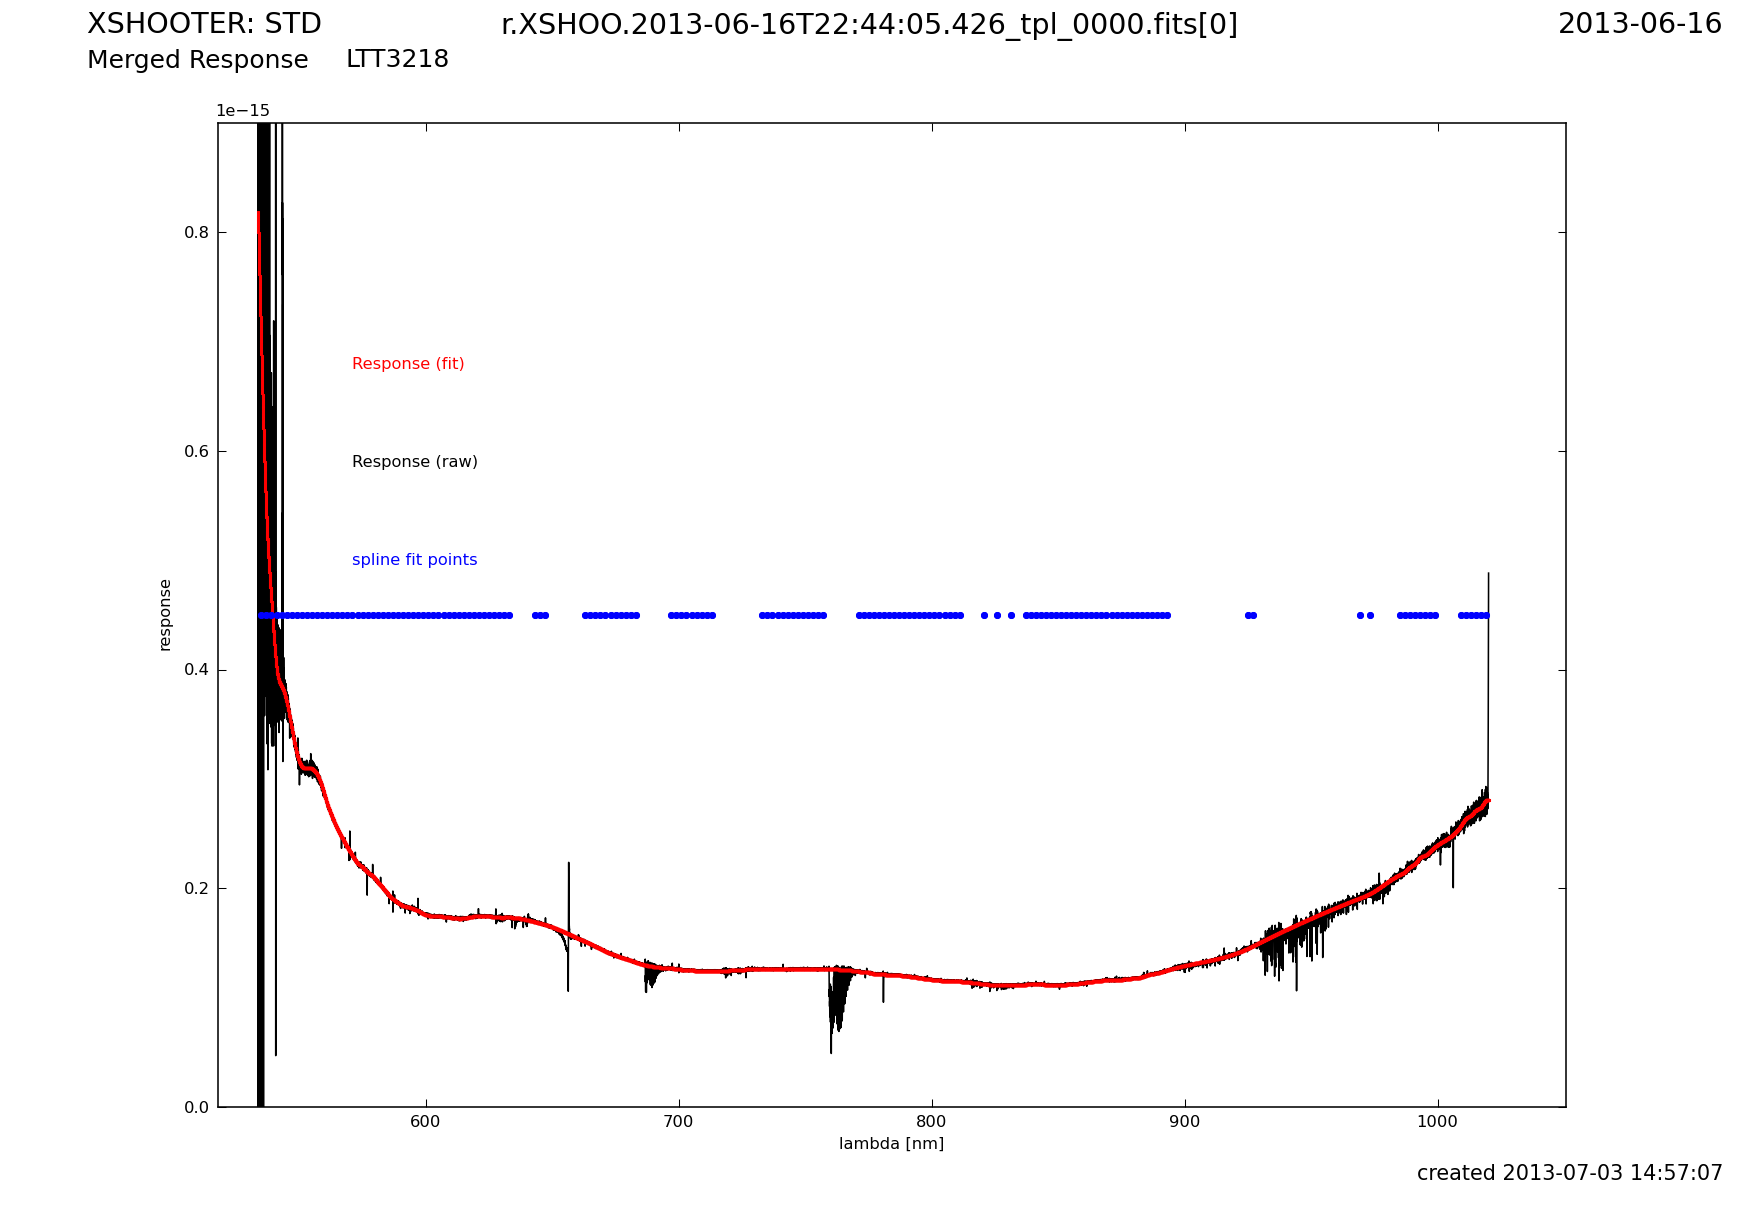
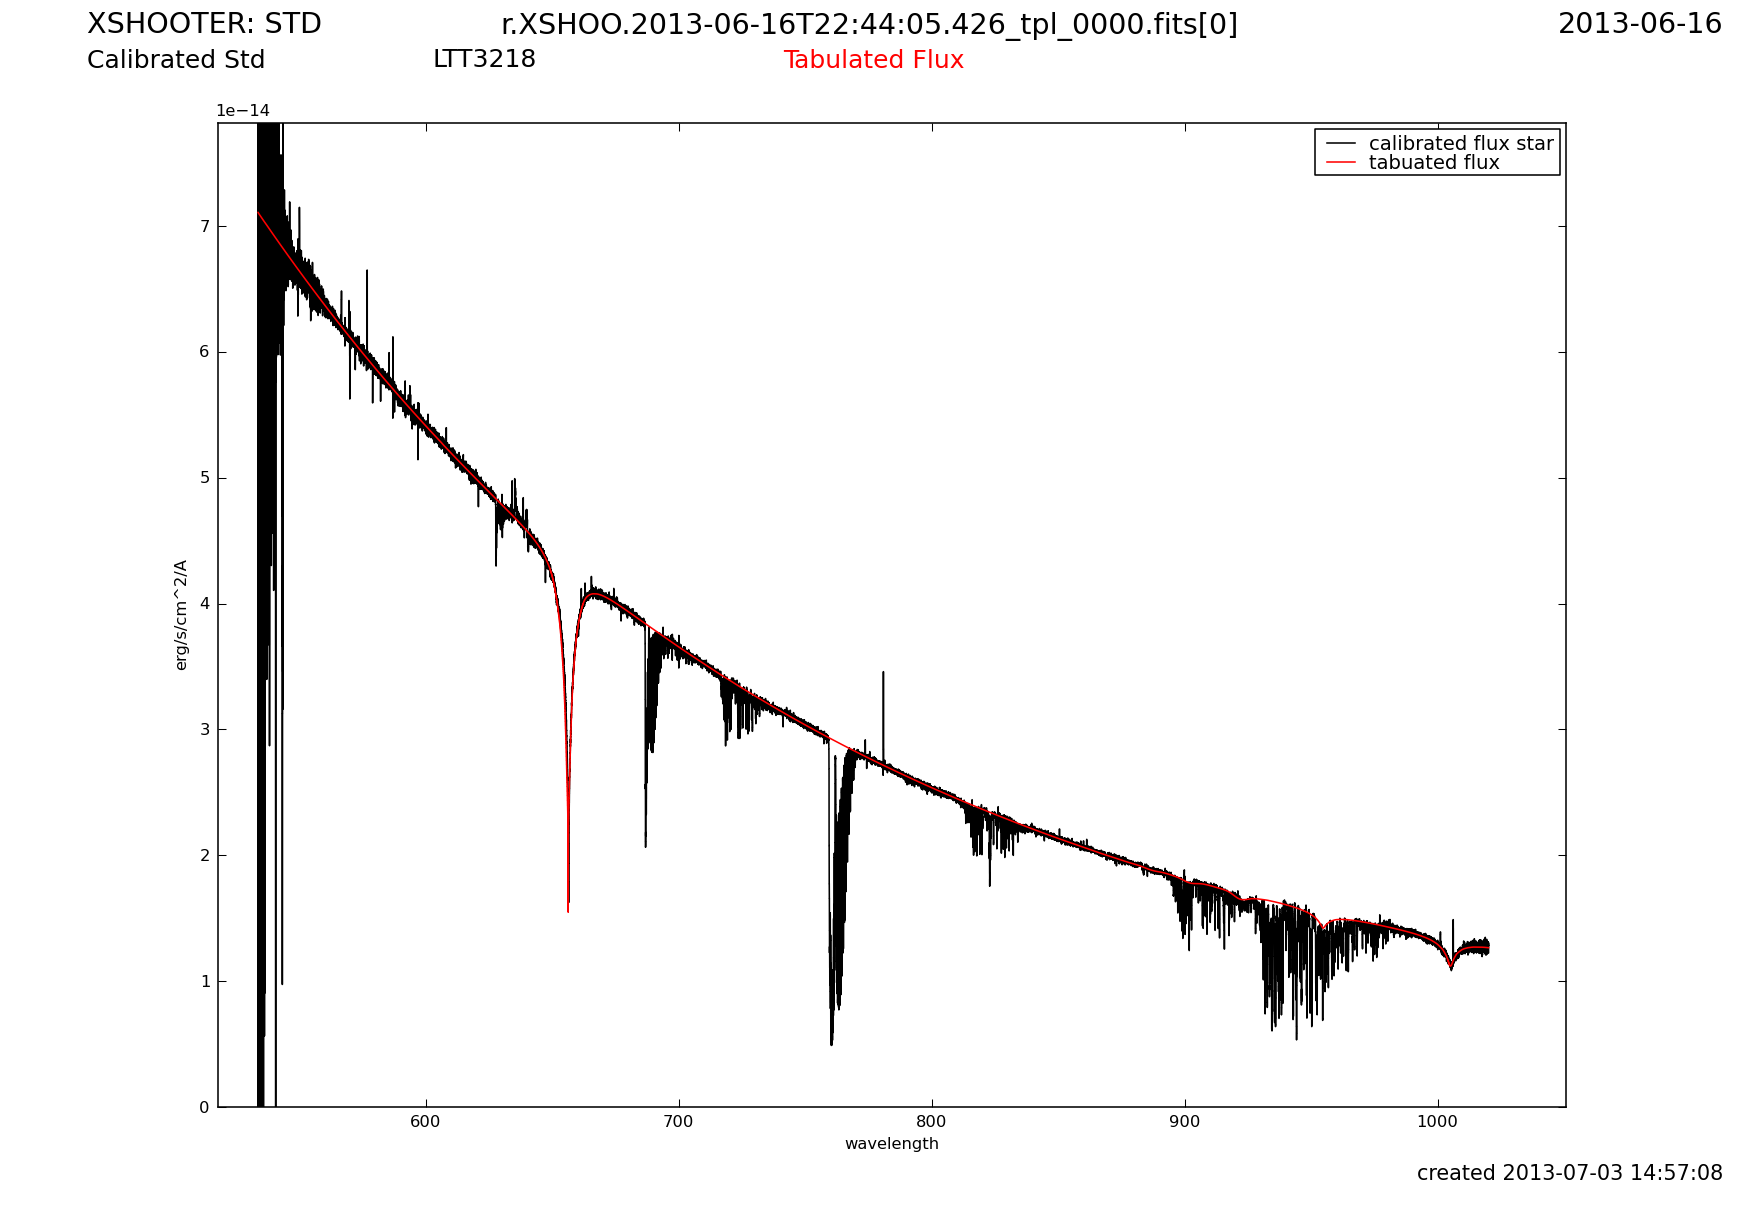
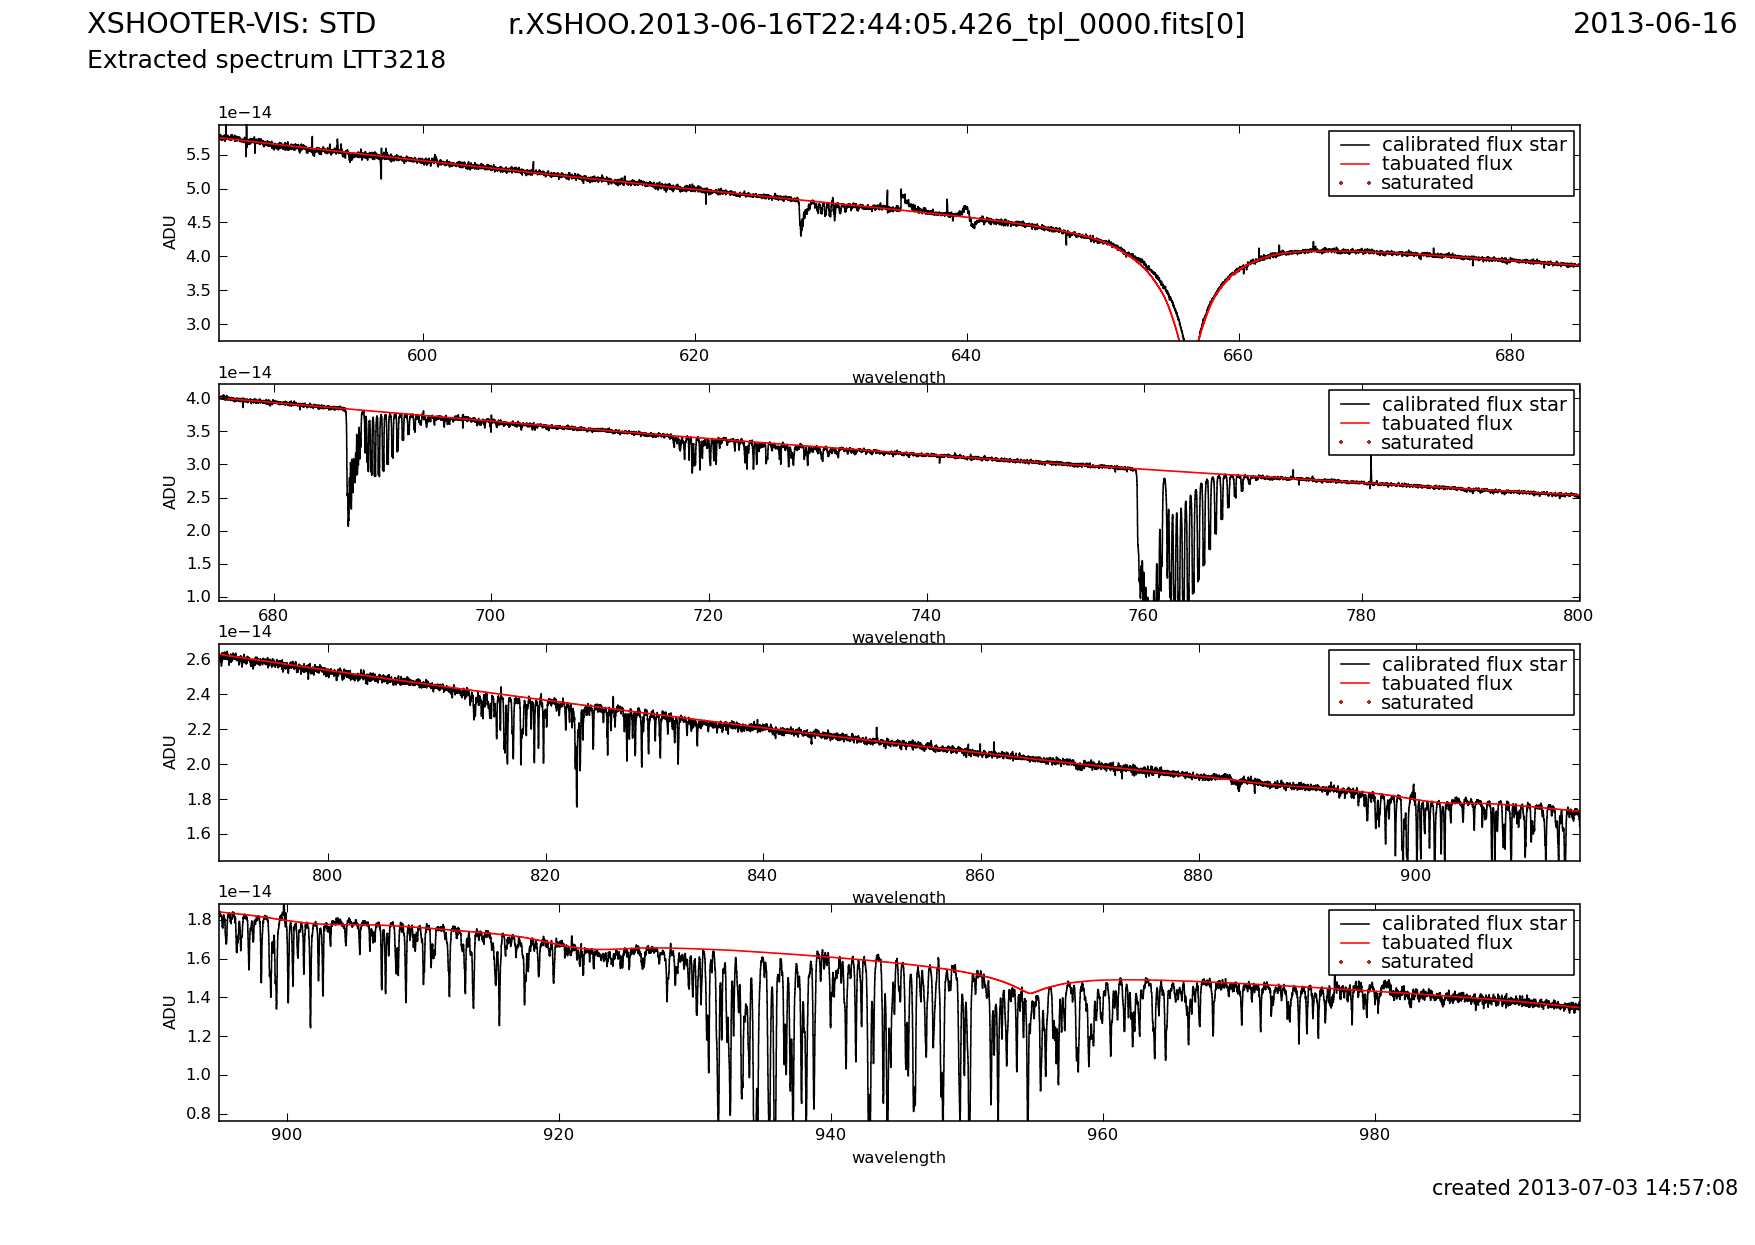
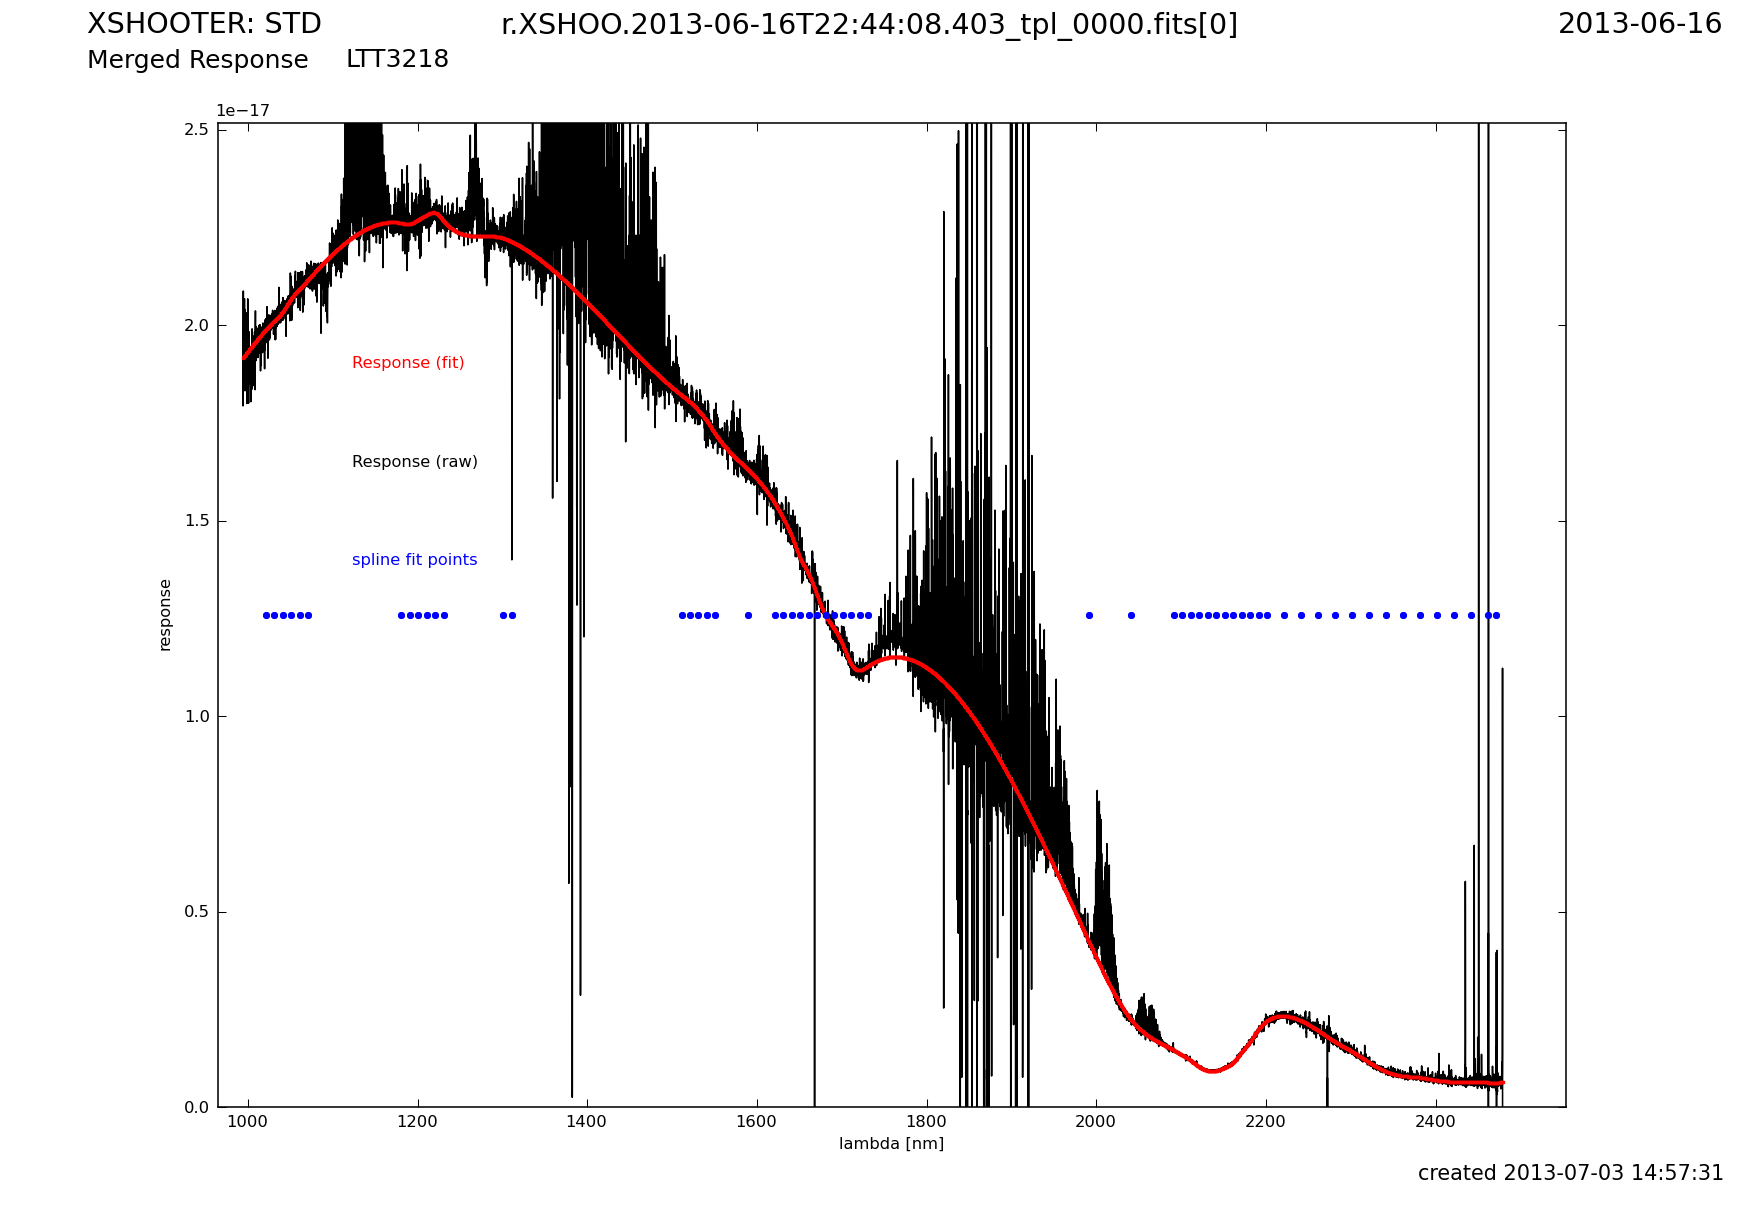
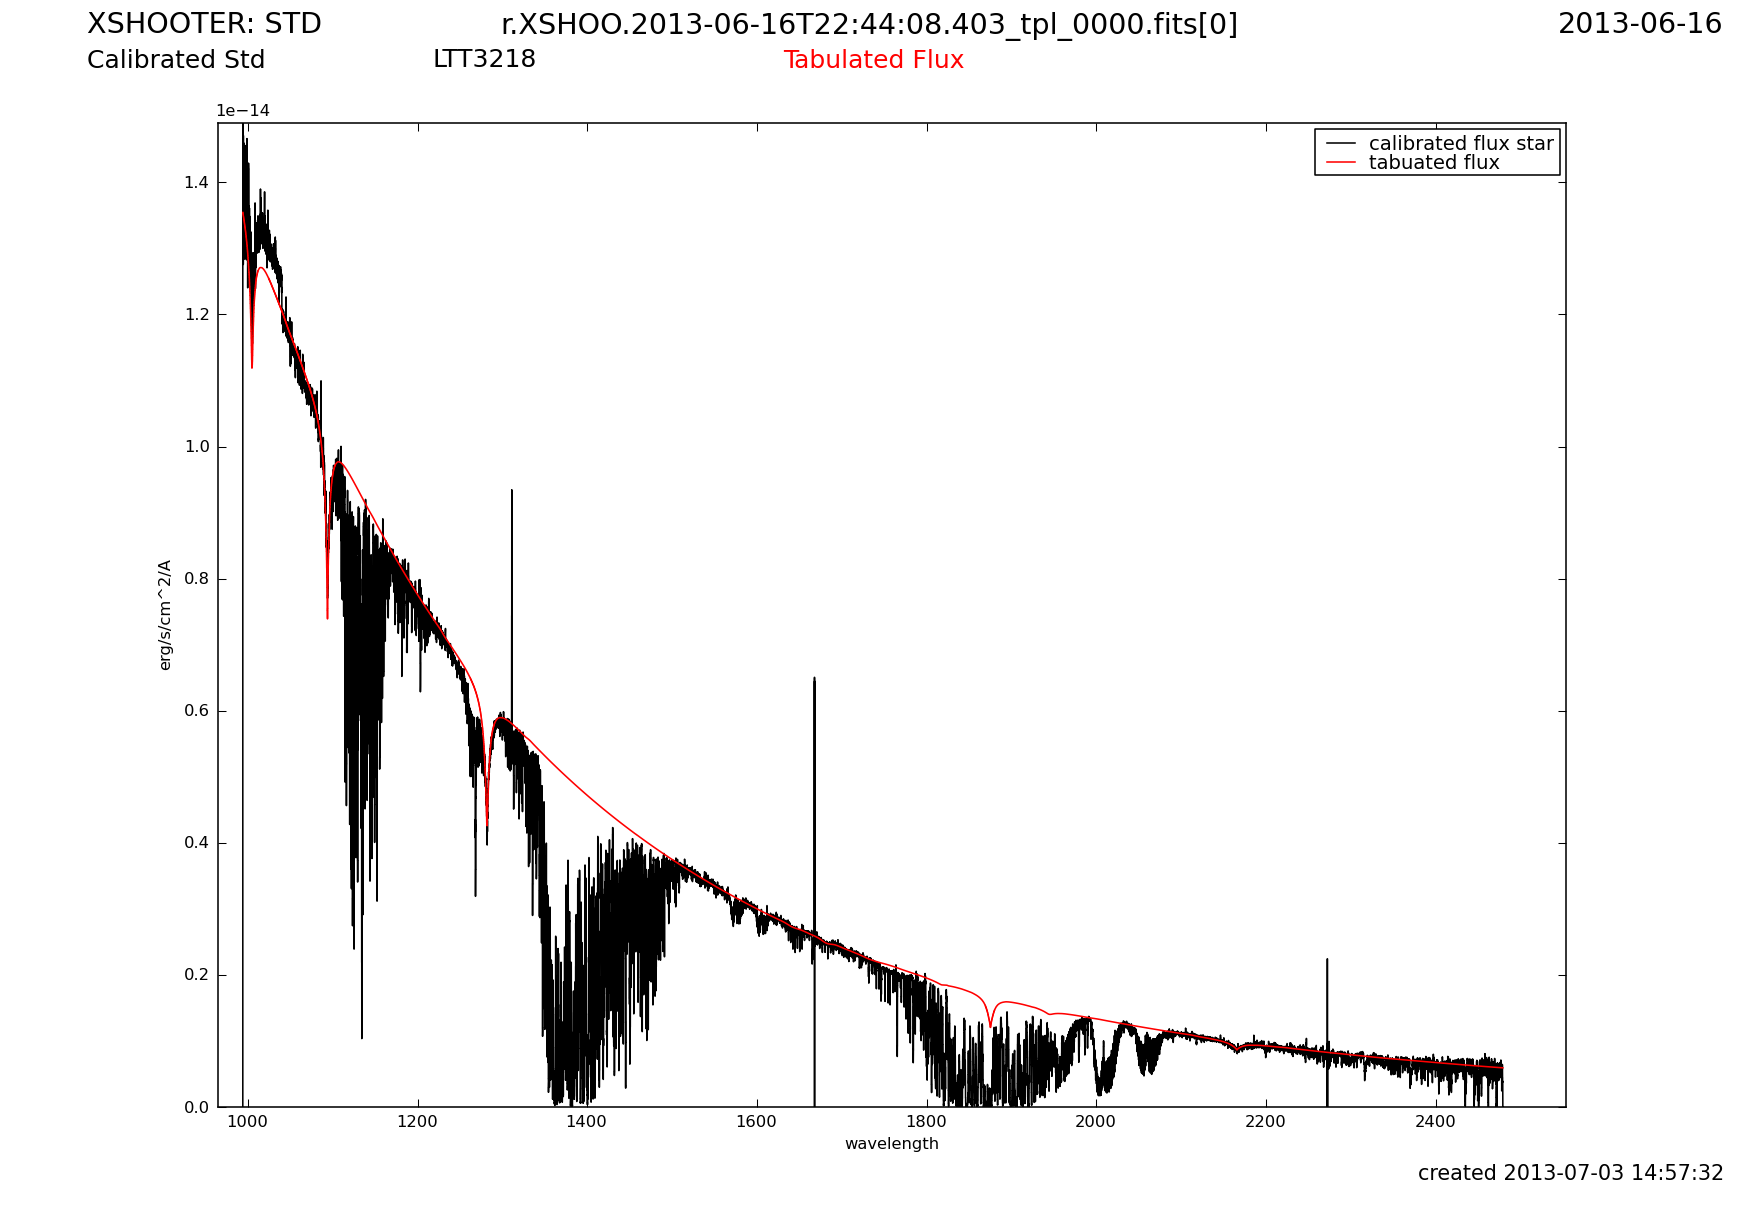
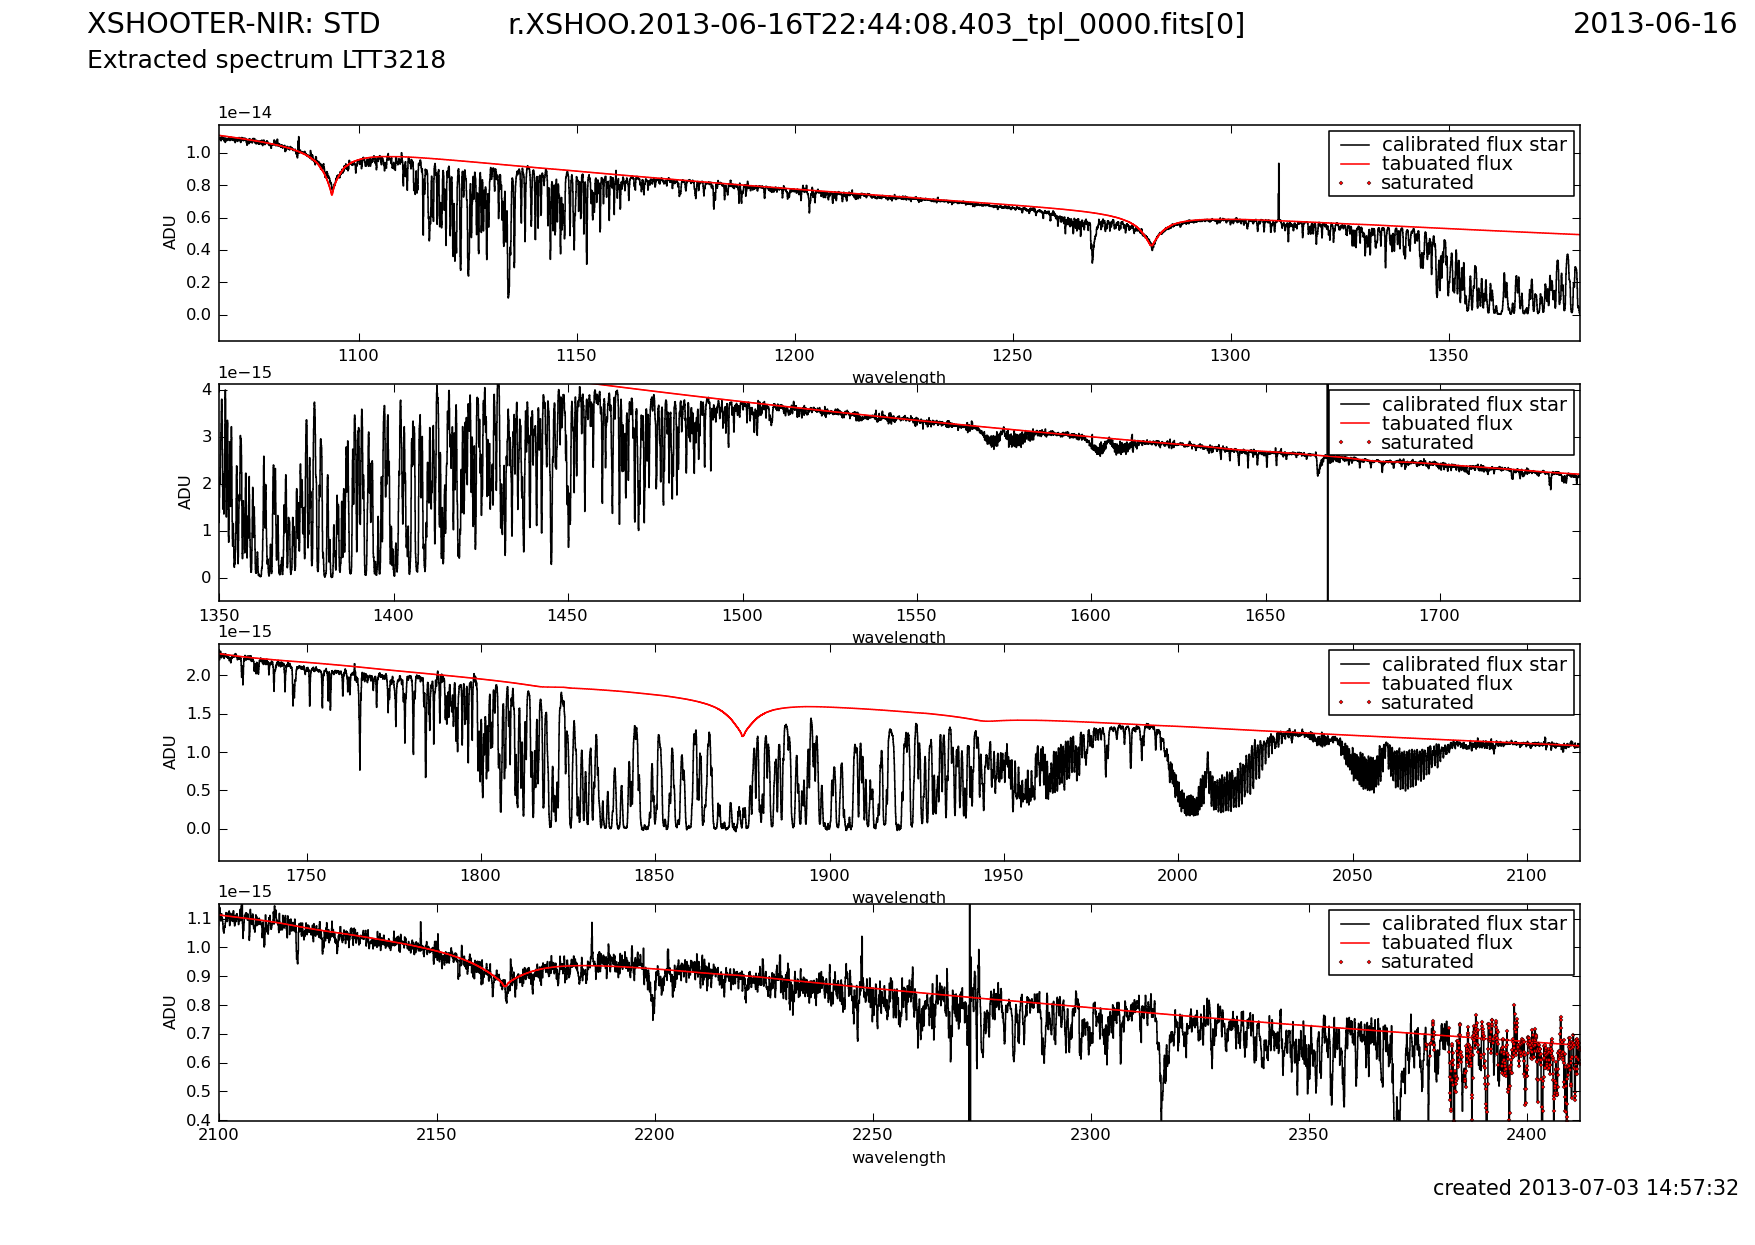
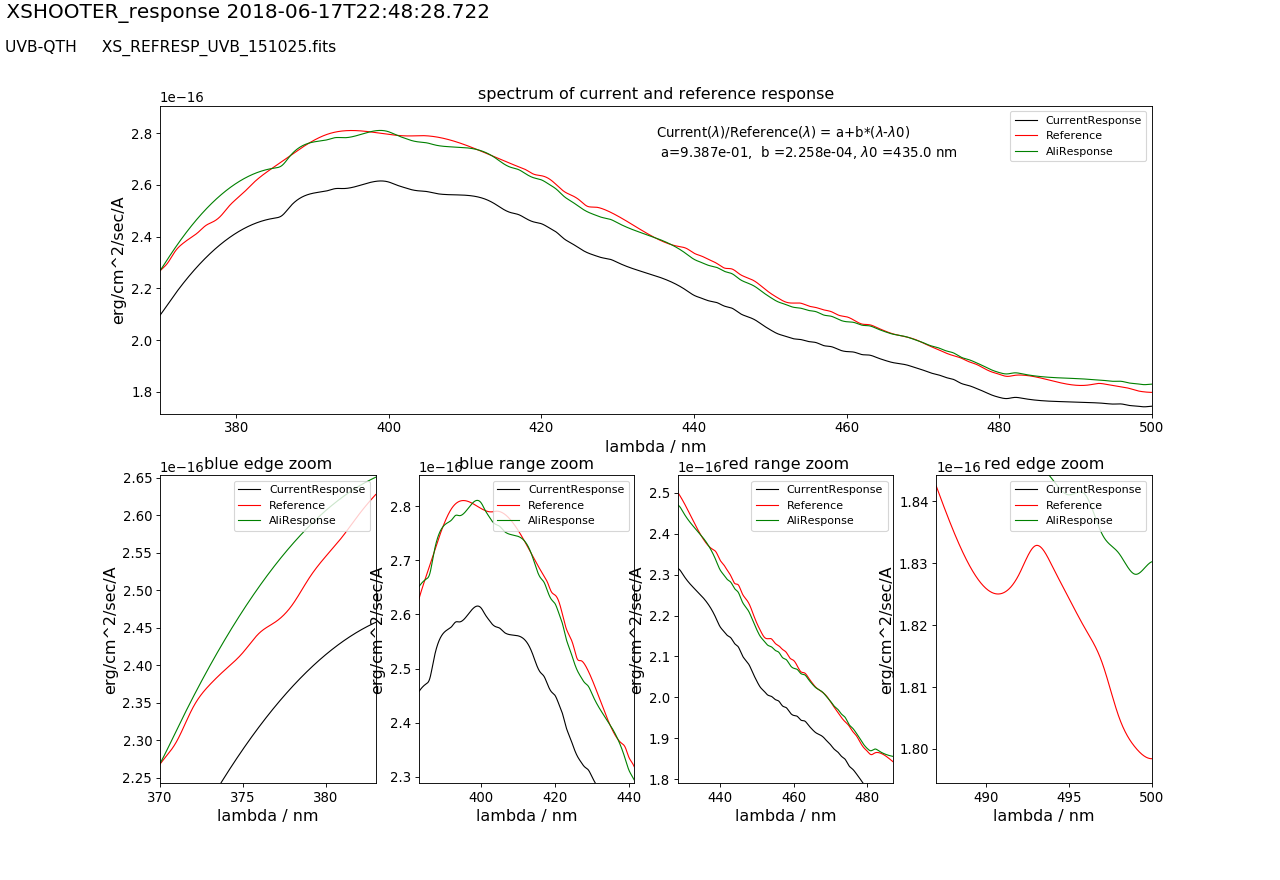
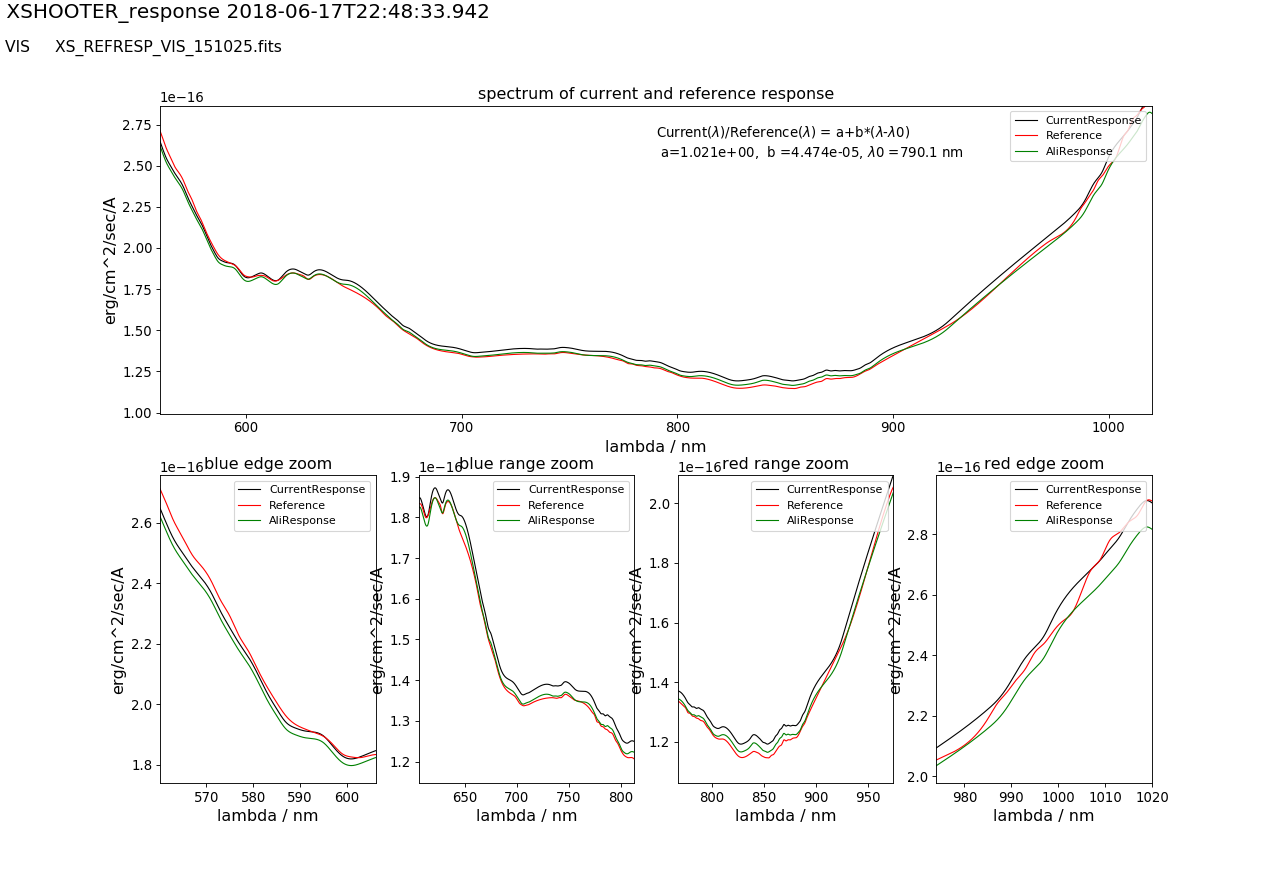
Example QC reports on the response function for LTT3128 acquired on 2013-06-16 are given below:
Comments on the Figures:
UVB:
- The wiggles in the UVB arm at 330 nm are telluric ozone, OIII features not covered by the model.
- The prominent absorption at 570 nm is an instrumental effect.
- The discontinuity of the response at ~370 nm comes from the flat field, which is composed of two lamps covering different orders of the echelle spectrum.
NIR:
- The response function given in the plot is corrected for telluric absorption.
- The background in the K-band is high exceeding the 42000 ADU limit of the NIR-detector.
Pixel with extrapolated flux (> 42000 ADU) are marked with the tag 'saturated'
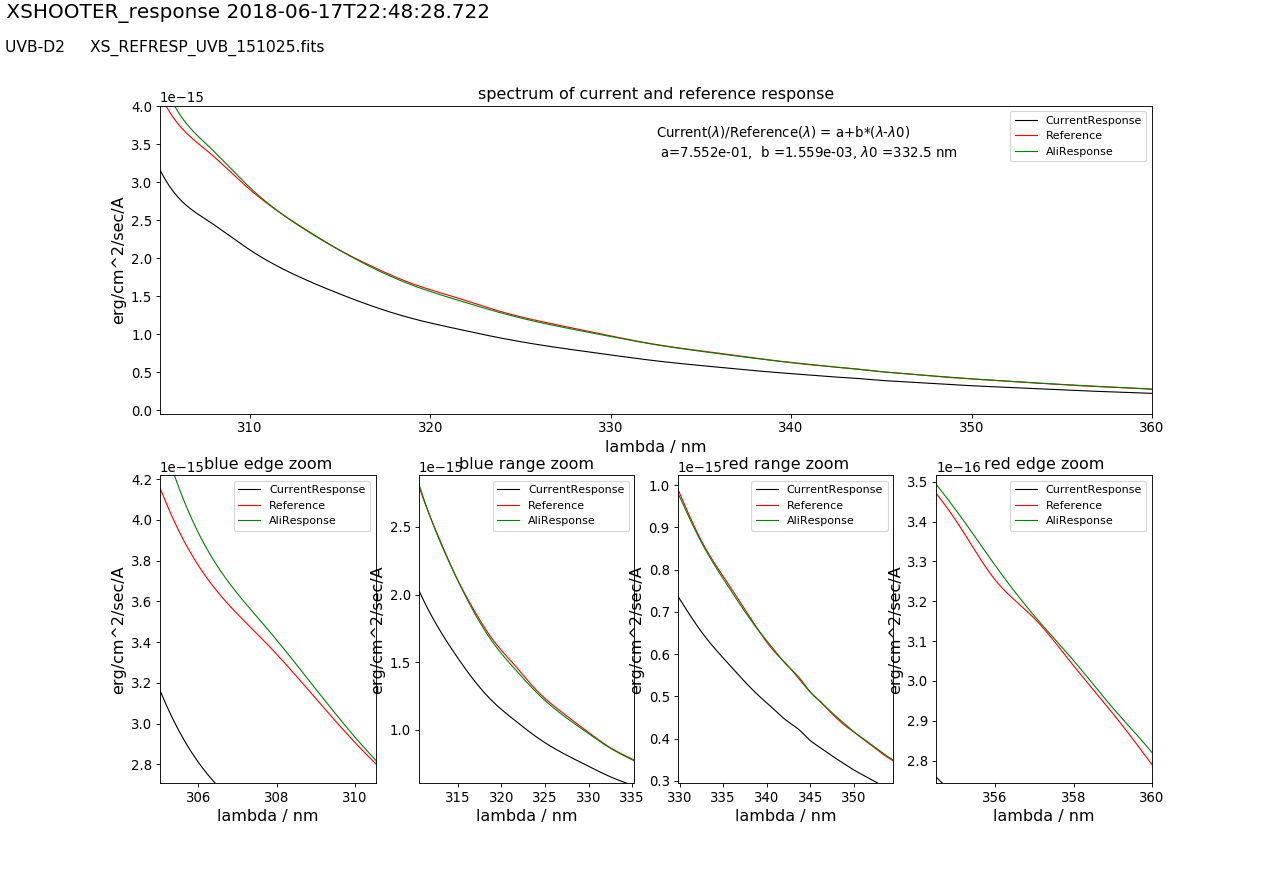 |
UVB-arm, D2-lamp calibrated spectral region, current response function (black), reference response function from 2015 (red)
and current response function aligned to the reference response function
with a linear least square fit (green).
|
 |
UVB-arm, QTH-lamp calibrated spectral region, current response function (black), reference response function from 2015 (red)
and current response function aligned to the reference response function
with a linear least square fit (green).
|
 |
VIS-arm current response function (black), reference response function from 2015 (red)
and current response function aligned to the reference response function
with a linear least square fit (green). The intensity has been scaled by 2% (a=1.021)
and the gradient has been modified by b=4.47e-5. Top box:
the full wavelength range of the arm. Bottom: four zoomed in spectral regions.
|
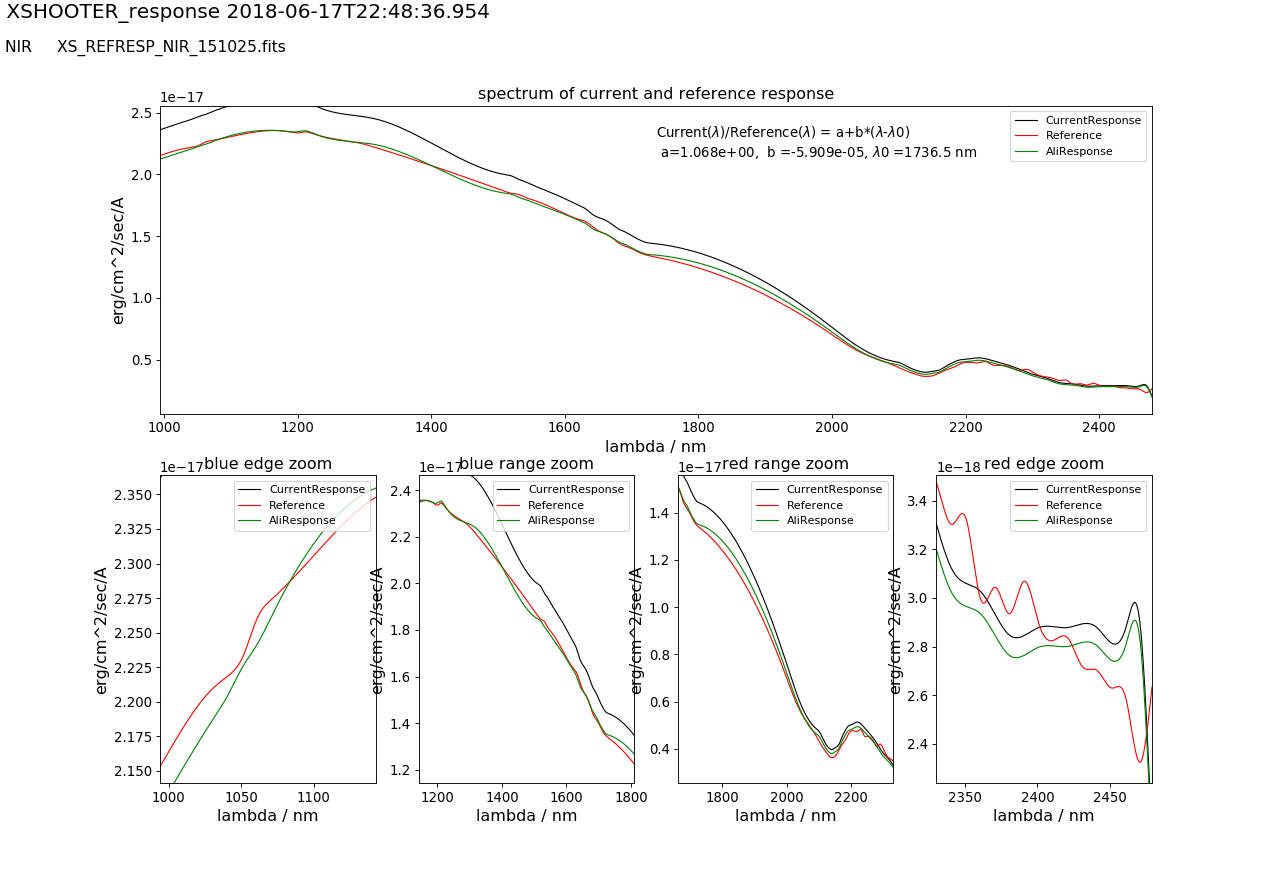 |
NIR-arm current response function (black), reference response function from 2015 (red)
and current response function aligned to the reference response function
with a linear least square fit (green).
|
QC1_parameters
| FITS key |
QC1 database: table, name |
definition |
class* |
HC_plot** |
more docu |
| [calculated by QC procedure] | xshooter_fluxeff..response_spec_a | current/reference spectrum ratio | HC | | [docuSys coming] |
| [calculated by QC procedure] | xshooter_fluxeff..response_spec_b | current/reference spectrum slope | HC | | [docuSys coming] |
| [calculated by QC procedure] | xshooter_fluxeff..response_spec_da | error in cur/ref spectrum ratio | HC | | [docuSys coming] |
| [calculated by QC procedure] | xshooter_fluxeff..response_spec_db | error in cur/ref spectrum slope | HC | | [docuSys coming] |
*Class: KPI - instrument performance; HC - instrument health; CAL - calibration quality; ENG - engineering parameter
**There might be more than one. |
Trending
a is the overall intensity scaling parameter and compensates for the daily altering
atmospheric conditions and potential aging of the instruments throughput
b is the first order chromatic deviation from the reference response function, a spectral gradient.
Scoring&thresholds Response function (for flux standard stars only)
The QC parameters are not scored
History
The processing of flux standard stars are been improved since 2013-06. The improvements include:
- Spectrophotometric reference spectra are based on model atmospheres
- For the VIS and NIR-arm the observed flux standard star spectrum is corrected for telluric absorption to improve the stability and quality of the spline fit.
- The smoothing of the ratio spectrum (the response function) is no longer performed by a masking technique but by a grid point technique.
- 2018-09: The VIS-arm response beomes redder
- 2019-01: The flat field lamp exchanges are no longer marked.
Algorithm Response function (for flux standard stars only)
The response function is parameterized in terms
of a linear fit with respect to a reference
response function to monitor the relative slope
of the spectrum. This is done in the same way as
for the 5 arcsec slit flats, which is described
here.
|