Plot
? |
Symb
? |
Source
* |
Average ? |
Thresholds ? |
N_
data |
QC1
parameter |
Data
downloads |
Remarks |
| method |
value |
unit |
method |
value |
| 1 |
• | QC1DB |
none |
|
NONE |
none | |
3442 |
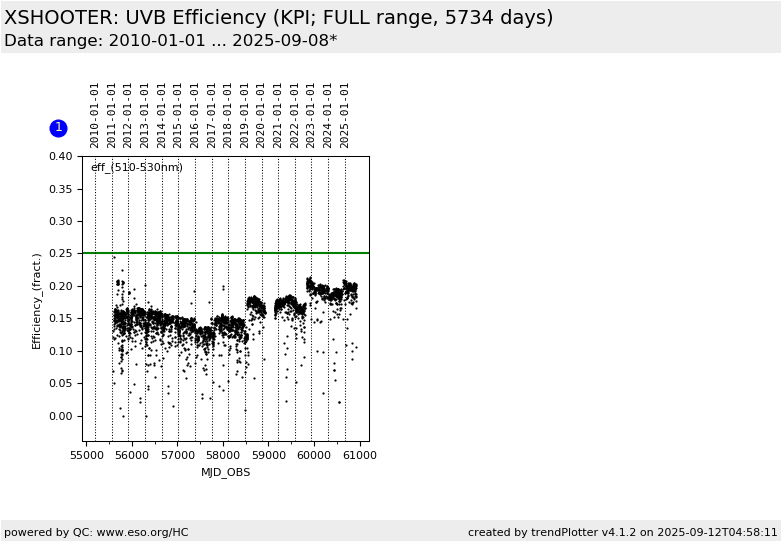
eff2 |
all (full time range)
| Relative efficiency for UVB arm, range 5100A - 5300A |
| |
|
*Data sources: QC1DB: QC1 database; LOCAL: local data source
|
| Plot 1 | | data source: | xshooter_fluxeff
(QC1 database) |
| dataset: | eff2 | • |
| average: | none |
| thresholds: | none |
| N_data plotted: | 3442 |
| (current) reference: | 0.25 |
| [click plot for closeup] |
According to
- ESO-327242, Integrating Instrument Performance in the Quality Control Process - X-shooter
- VLT-SPE-ESO-14650-3323, X-SHOOTER Technical Specification
The efficiency is specified to be
- >8% at any wavelength and
- >25% in the center of all orders.
Here we monitor the wavelength averaged efficiency
in the given wavelength range.
(The 25% efficiency is reached only in the center of a few orders. See the efficiency QC report).
General information
Click on any of the plots to see a close-up version.
The latest date is indicated on top of the plot.
If configured,
- data points belonging to the latest date are specially marked
- statistical averages are indicated by a solid line, and thresholds by broken lines
- outliers are marked by a red asterisk. They are defined as data points outside the
threshold lines
- "aliens" (= data points outside the plot Y limits) are marked by a red arrow (↑ or ↓)
- you can download the data for each parameter set if the 'Data downloads' link shows up
|
