mirror sites: PL HQ

Health Check monitor


CAL | HC | refs | QC
HealthCheck Monitor
   HOME | UsersGuide
  sl icon ALL INSTRUMENTS
XSHOOTER:
wavelength calib.
Other HC:
QC links:
        [page auto-refreshes after 300 sec]   [stop | on]            [press Ctrl+R to enforce refresh of scores and dates]
XSHOOTER trending system: HEALTH CHECK report
Last update: 2012-05-24T23:16:35 (UT)
| now: 2012-05-24T23:19:45 (UT)
HELP USERS-GUIDE MORE
same group: wavecal_slit wave_slit_time wave_ifu_time
General news: 2012-05-24: The HC monitors for OMEGACAM, VIRCAM and HAWKI are back. Population with current data is in progress.
XSHOOTER news: 2112-05-15: Garching pipeline upgraded to v1.4.8
Report news: large difference between 9-pinhole and arc-slit calibration
DATE*: [?] 2012-05-17
report | NR
2012-05-18
report | NR
2012-05-19
report | NR
2012-05-20
report | NR
2012-05-21
report | NR
2012-05-22
report | NR
2012-05-23
report | NR
2012-05-24
no data | NR
P...
Product quality:
products products products products products products products no products
  no OPSLOG data  

scores&comments | history ... | plot tutorial ... | contact                 daily/often; important to check     [?]
*Date on this monitor changes at 21:00 UT
Print: Information and research:
- png file - advanced studies: QC1 browser | QC1 plotter
Plot
?
Symb
?
Source
*
OPS?
**
Average ? Thresholds ? N_
data
QC1
parameter
Data
downloads
Remarks
method value unit method value
1 QC1DB no none   NONE VAL360,460 18 nline_found this | last_yr | all number of lines identified
2 QC1DB no none   NONE VAL12700,14000 18 resol_med this | last_yr | all average resolution (bad lines clipped)
3 QC1DB no none   NONE VAL-1.6,0.9 18 model_diffy_med this | last_yr | all median difference in y between 9-pinhole and slit data
4 QC1DB no none   NONE VAL0.1,1.1 18 model_diffy_rms this | last_yr | all rms of difference in y between 9-pinhole and slit data
*Data sources: QC1DB: QC1 database; LOCAL: local text file | **OPS: to indicate that OPSLOG data are included
Plot 1
scores: 5|
data source:xshooter_wavecal
(QC1 database)
dataset:nline_found
average:none
fixed thresholds:360.0...460.0NONE
N_data plotted:18
[click on plot for closeup]
Plot 2
scores: 5|
data source:xshooter_wavecal
(QC1 database)
dataset:resol_med
average:none
fixed thresholds:12700.0...14000.0NONE
N_data plotted:18
[click on plot for closeup]
Plot 3
scores: 5|
data source:xshooter_wavecal
(QC1 database)
dataset:model_diffy_med
average:none
fixed thresholds:-1.6...0.9NONE
N_data plotted:18
[click on plot for closeup]
Plot 4
scores: 5|
data source:xshooter_wavecal
(QC1 database)
dataset:model_diffy_rms
average:none
fixed thresholds:0.1...1.1NONE
N_data plotted:18
[click on plot for closeup]
This plot

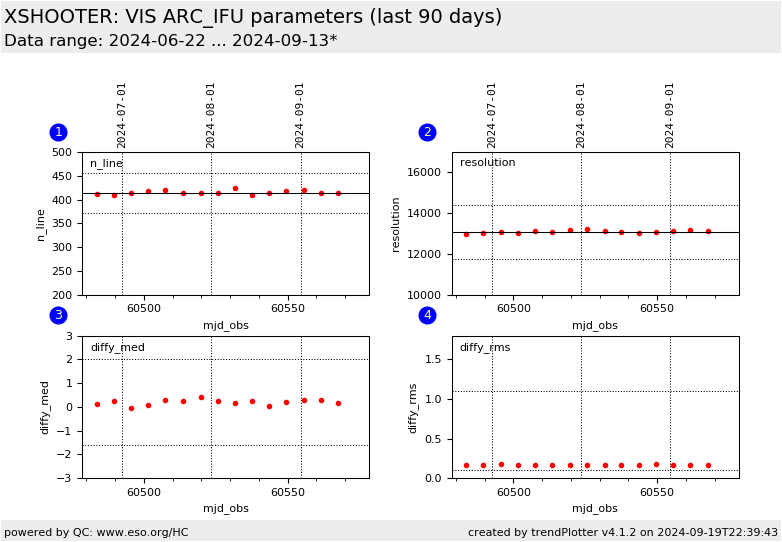
These plots show information derived from arc IFU observations vs. time. For more information see the plot tutorial page.  


General information

Click on any of the plots to see a close-up version. The latest date is indicated on top of the plot, data points belonging to that date are specially marked.

If configured,

  • statistical averages are indicated by a solid line, and thresholds by broken lines
  • outliers are marked by a red asterisk. They are defined as data points outside the threshold lines
  • "aliens" (= data points outside the plot Y limits) are marked by a red arrow ( or )
  • you can download the data for each parameter set if the 'Data downloads' link shows up