Plot
? |
Symb
? |
Source
* |
Average ? |
Thresholds ? |
N_
data |
QC1
parameter |
Data
downloads |
Remarks |
| method |
value |
unit |
method |
value |
| 1 |
• | QC1DB |
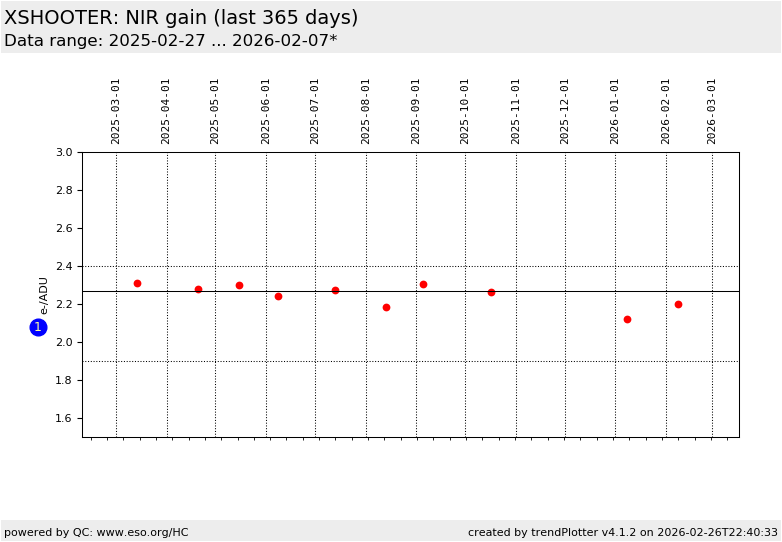
MEDIAN |
2.26 |
e-/ADU |
VAL | 1.9,2.4 |
10 |
gain |
this |
last_yr |
all
|
NIR gain |
| |
|
*Data sources: QC1DB: QC1 database; LOCAL: local data source
|
Plot 1
scores:  1| 1|
| | data source: | xshooter_detmon
(QC1 database) |
| dataset: | gain | • |
| median: | 2.26 | e-/ADU |
| fixed thresholds: | 1.9...2.4 | e-/ADU |
| N_data plotted: | 10 |
| [click plot for closeup] |
The gain is derived from a set of paired flat fields with identical exposure
time, using the Photon Transfer Curve method. Since the NIR arm can take only
echelle flats we specify a small window on one order.
2013-08-01: The thresholds have been modified (flats of more counts
are included for the analysis) resulting in a higher sensitivity of the
non-linearity QC parameter. As a side effect, the gain values become
more affected by the non-linearity. The more high counts flats are included,
the smaller the retrieved gain value.
For more information see the
plot tutorial page.
General information
Click on any of the plots to see a close-up version.
The latest date is indicated on top of the plot.
If configured,
- data points belonging to the latest date are specially marked
- statistical averages are indicated by a solid line, and thresholds by broken lines
- outliers are marked by a red asterisk. They are defined as data points outside the
threshold lines
- "aliens" (= data points outside the plot Y limits) are marked by a red arrow (↑ or ↓)
- you can download the data for each parameter set if the 'Data downloads' link shows up
|
