Plot
? |
Symb
? |
Source
* |
Average ? |
Thresholds ? |
N_
data |
QC1
parameter |
Data
downloads |
Remarks |
| method |
value |
unit |
method |
value |
| 1 |
• | QC1DB |
MEDIAN |
290 |
NONE |
VAL | 270,320 |
86 |
nline_found_clean |
this |
last_yr |
all
|
number of lines identified in format check (= 1 pinhole arc) |
| 2 |
• | QC1DB |
MEDIAN |
205 |
NONE |
VAL | 170,250 |
91 |
nline_found_clean |
this |
last_yr |
all
|
number of lines identified in 2dmap, divided by 9 |
| 3 |
• | QC1DB |
MEDIAN |
16 |
NONE |
VAL | 16,16 |
80 |
n_order_det |
this |
last_yr |
all
|
number of detected orders from 1 pinhole flat |
| |
|
*Data sources: QC1DB: QC1 database; LOCAL: local data source
|
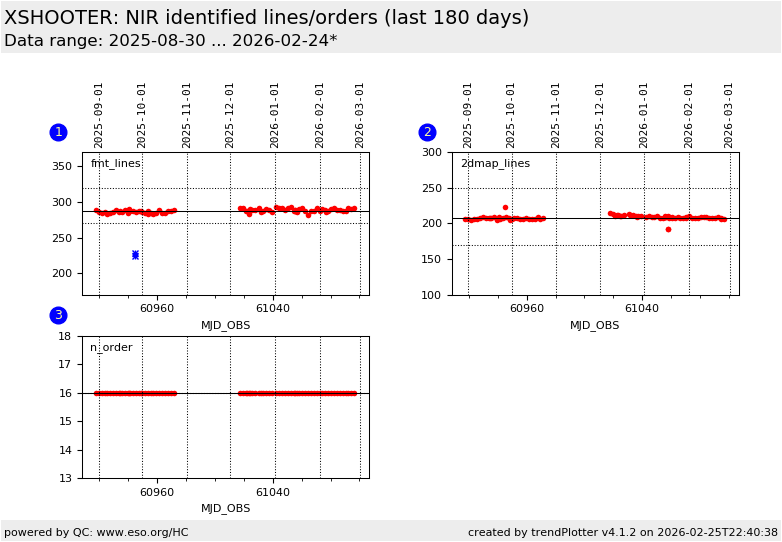
Plot 1
scores:  5| 5|
| | data source: | xshooter_format
(QC1 database) |
| dataset: | nline_found_clean | • |
| median: | 290 | NONE |
| fixed thresholds: | 270...320 | NONE |
| N_data plotted: | 86 |
| [click plot for closeup] |
Plot 3
scores: 4|
| | data source: | xshooter_order
(QC1 database) |
| dataset: | n_order_det | • |
| median: | 16 | NONE |
| fixed thresholds: | 16...16 | NONE |
| N_data plotted: | 80 |
| [click plot for closeup] |
Plot 2
scores: not implemented
| | data source: | xshooter_2dmap
(QC1 database) |
| dataset: | nline_found_clean | • |
| median: | 205 | NONE |
| fixed thresholds: | 170...250 | NONE |
| N_data plotted: | 91 |
| [click plot for closeup] |
This plot shows
- the number of identified arc lines in (RAW_TYPE = FMTCHK, recipe =
xsh_predict, 1 single-pinhole) frames
- the number of identified arc lines in (RAW_TYPE = WAVE, recipe =
xsh_2dmap, 1 9-pinhole arc) frames
- the number of identified orders (RAW_TYPE = ORDERDEF, recipe =
xsh_orderpos, 1 flat and 1 single-pinhole) frames
More information can be found in the
plot tutorial page.
General information
Click on any of the plots to see a close-up version.
The latest date is indicated on top of the plot.
If configured,
- data points belonging to the latest date are specially marked
- statistical averages are indicated by a solid line, and thresholds by broken lines
- outliers are marked by a red asterisk. They are defined as data points outside the
threshold lines
- "aliens" (= data points outside the plot Y limits) are marked by a red arrow (↑ or ↓)
- you can download the data for each parameter set if the 'Data downloads' link shows up
|
