Plot
? |
Symb
? |
Source
* |
Average ? |
Thresholds ? |
N_
data |
QC1
parameter |
Data
downloads |
Remarks |
| method |
value |
unit |
method |
value |
| 1 |
• | QC1DB |
MEDIAN |
1.01 |
flux_ratio |
none | |
33 |
response_spec_a |
this |
last_yr |
all
|
current response / reference response = a + b * (lam - lam0) |
| 2 |
• | QC1DB |
MEDIAN |
0.000157 |
1/nm |
none | |
33 |
response_spec_b |
this |
last_yr |
all
|
current response / reference response = a + b * (lam - lam0) |
| 3 |
• | QC1DB |
MEDIAN |
1.06 |
flux_ratio |
none | |
33 |
response_spec_m_a |
this |
last_yr |
all
|
current response / master response = a + b * (lam - lam0) |
| 4 |
• | QC1DB |
MEDIAN |
0.00024 |
1/nm |
none | |
33 |
response_spec_m_b |
this |
last_yr |
all
|
current response / master response = a + b * (lam - lam0) |
| |
|
*Data sources: QC1DB: QC1 database; LOCAL: local data source
|
Plot 1
scores: not implemented
| | data source: | xshooter_fluxeff
(QC1 database) |
| dataset: | response_spec_a | • |
| median: | 1.01 | flux_ratio |
| thresholds: | none | |
| N_data plotted: | 33 |
| [click plot for closeup] |
Plot 2
scores: not implemented
| | data source: | xshooter_fluxeff
(QC1 database) |
| dataset: | response_spec_b | • |
| median: | 0.000157 | 1/nm |
| thresholds: | none | |
| N_data plotted: | 33 |
| [click plot for closeup] |
Plot 3
scores: not implemented
| | data source: | xshooter_fluxeff
(QC1 database) |
| dataset: | response_spec_m_a | • |
| median: | 1.06 | flux_ratio |
| thresholds: | none | |
| N_data plotted: | 33 |
| [click plot for closeup] |
Plot 4
scores: not implemented
| | data source: | xshooter_fluxeff
(QC1 database) |
| dataset: | response_spec_m_b | • |
| median: | 0.00024 | 1/nm |
| thresholds: | none | |
| N_data plotted: | 33 |
| [click plot for closeup] |
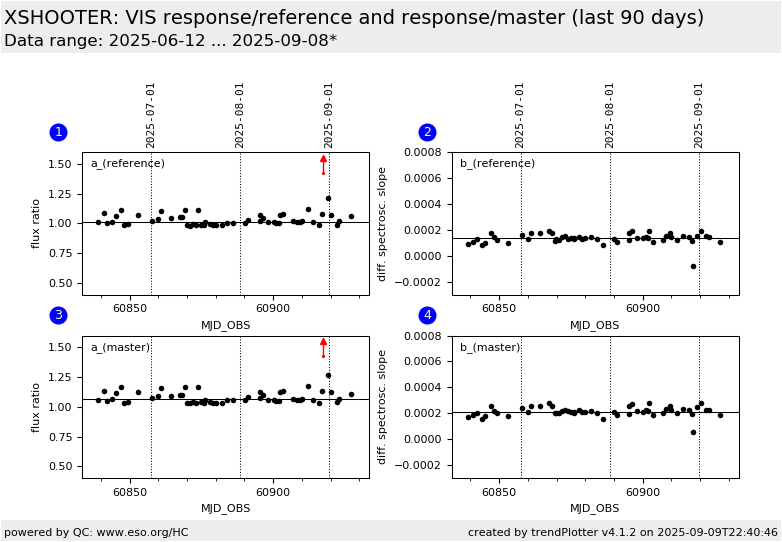
This plot monitors the XSHOOTER response function.
For this reason the response functions are
compared to
- a) a reference response functions acquired on 2015-10-25 and
- b) the master response function which is a clean and weighted average of
response functions with a certain validity range.
On 2015-10-25, the first flux standard star was acquired with the effmon
template, meaning this observation was acquired under strict photometric
conditions. The calibration product 'response function' from that date
serves as a reference in the following. It is marked by a vertical red bar in
the history plot.
The master response function once generated as a weighted and clean mean of
response functions for the purpose to flux calibrate XSHOOTER science observations
(internal data producs = IDPs) is a representative response function for a given
time range.
The comparison between the reference
response function (from 2015-10-25, ARCFILE=XSHOO.2015-10-26T01:23...) and the current response function
as well as the comparison between the master response and the current response
is parameterized via
current(lambda) / reference(lambda) = a + b * (lambda - lambda_0 )
current(lambda) / master(lambda) = a + b * ( lambda - lambda_0 )
where lambda_0 is the center wavelength of the considered wavelength range,
parameter a is the relative overall flux of the spectrum, corresponding to atmospheric variations and
parameter b is a first order chromatic deviation (the slope between the reference(/master) and
the current). This plot shows both parameters a and b, of which parameter b is the important one.
On 2015-10-25, there is a=1 and b=0 by definition.
The response function is a flat-fielded efficiency, hence the response
function depends on the spectral shape of the flat field lamp,
on long-term changes as well as on exchanges of the lamp. For this reason, dates of
lamp exchanges are marked by blue vertical bars.
Notes:
- UVB-arm: the D2 lamp illuminated orders [305 - 360] nm and the QTH lamp
illuminated orders [370 - 500] nm are fit separately. The redest order of the QTH
lamp illuminated orders is not used for the fit due no known variations
of the dichroic.
- VIS-arm: The bluest orders are not used for the fit due to
known variations of the dichroic: [560 - 1020] nm.
- NIR-arm: The full range is used for the fit [1000 - 2460]
nm.
General information
Click on any of the plots to see a close-up version.
The latest date is indicated on top of the plot.
If configured,
- data points belonging to the latest date are specially marked
- statistical averages are indicated by a solid line, and thresholds by broken lines
- outliers are marked by a red asterisk. They are defined as data points outside the
threshold lines
- "aliens" (= data points outside the plot Y limits) are marked by a red arrow (↑ or ↓)
- you can download the data for each parameter set if the 'Data downloads' link shows up
|
