MUSE: Wavelength solution and resolution
| |
| HC PLOTS |
| Resolution in Nominal(N) mode |
 |
| Resolution in Extended(E) mode |
|
| Resolution per channel |
|
| Wavelength calibration fit N mode |
|
| Wavelength calibration fit E mode |
|
| Flux of arc lamps |
|
|
QC1 database (advanced users):
browse |
plot
|
Arc lamp calibrations are taken regularly in one instrumental
setup: INS.MODE=WFM-NOAO-N, INS.OPTI1.NAME=Blue,
DET.READ.CURNMAE=SCI1.0. Each set of wavelength calibrations
consists of fifteen input raw frames (multiple of 3)
from different arc lamps: Ne, Xe, and HgCd (5 input
frames per lamp). Whenever science observations are executed in
a different instrumental setup, the corresponding arc lamp
frames are taken as well, e.g, in the AO (Adaptive Optics) mode.
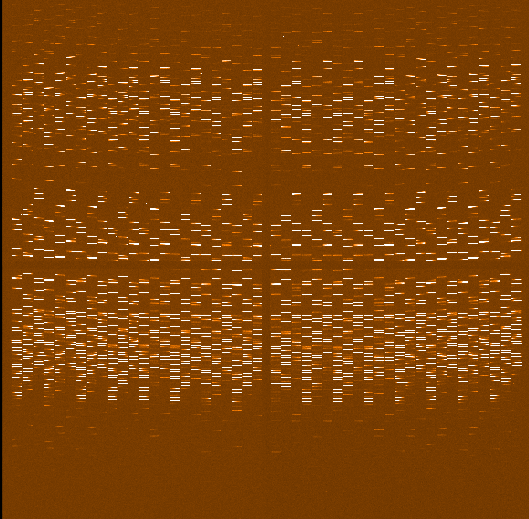 |
Arc lamp exposure. Example of the input arc frame -
the Ne lamp exposure, for CHANEL 10 (EXTNAME=CHAN10). Each of the 48
slices (vertical stripes) contains spectrum of the Ne lamp. The full
input arc frame contains 24 of such extensions - one extension for
each of 24 channels of MUSE.
|
 Resolution and Central Wavelength
QC1_parameters
| FITS key |
QC1 database: table, name |
definition |
class* |
HC_plot** |
more docu |
| QC.WAVECAL.SLICE24.RESOL | muse_wave..slice24_resol | Mean spectral resolution R determined in slice | HC | | [docuSys coming] |
| QC.WAVECAL.SLICE1.RESOL | muse_wave..slice1_resol | Mean spectral resolution R determined in slice | HC | | [docuSys coming] |
| QC.WAVECAL.SLICE24.WLEN | muse_wave..slice24_wlen | [Angstrom] Wavelength associated to WLPOS in slice | HC | | [docuSys coming] |
| QC.WAVECAL.SLICE1.WLEN | muse_wave..slice1_wlen | [Angstrom] Wavelength associated to WLPOS in slice | HC | | [docuSys coming] |
*Class: KPI - instrument performance; HC - instrument health; CAL - calibration quality; ENG - engineering parameter
**There might be more than one. |
Trending
The spectral resolution averaged across all
detectors (CHANELs), including rms, is monitored for
central slice24 and border slice1. We monitor it
separately for the data taken in the WFM, Nominal and
Extended modes (both NOAO and AO). Also, the resolution
is monitored for each detector. Only data taken in the
read-out mode (DET.READ.CURNAME) SCI1.0 are
selected.
Scoring&thresholds Resolution and Central Wavelength
The thresholds are used for the HC settings - the wavelength
calibrations taken in the WFM-NOAO-N and WFM-NOAO-E modes.
The lower thresholds for resolution are relatively tight to be
sensitive to a sudden degradation. The central wavelength is very
stable in general, so the thresholds are not so tight to avoid false alarms.
History
| Date |
event |
| February 2014 | wavelength calibrations are taken regularly |
Algorithm Resolution and Central Wavelength
To compute the wavelength solution, arc lines are detected at the
center of each slice (using threshold detection on a S/N image) and
subsequently assigned wavelengths, using pattern matching to identify
lines from the input line catalog. Each line is then traced to the
edges of the slice, using Gaussian centering in each CCD column. The
Gaussians not only yield center, but also centering error, and line
properties (e.g. FWHM).
Wavelength Calibration Fit
QC1_parameters
| FITS key |
QC1 database: table, name |
definition |
class* |
HC_plot** |
more docu |
| QC.WAVECAL.SLICE24.FIT.NLINES | muse_wave..slice24_fit_nlines | Number of arc lines used in calibration solution fit in slice | HC | | [docuSys coming] |
| QC.WAVECAL.SLICE1.FIT.NLINES | muse_wave..slice1_fit_nlines | Number of arc lines used in calibration solution fit in slice | HC | | [docuSys coming] |
| QC.WAVECAL.SLICE24.FIT.RMS | muse_wave..slice24_fit_rms | [Angstrom] RMS of the wavelength calibration fit in slice | HC | | [docuSys coming] |
| QC.WAVECAL.SLICE1.FIT.RMS | muse_wave..slice1_fit_rms | [Angstrom] RMS of the wavelength calibration fit in slice | HC | | [docuSys coming] |
*Class: KPI - instrument performance; HC - instrument health; CAL - calibration quality; ENG - engineering parameter
**There might be more than one. |
Trending
The number of identified arc lines used in
calibration solution fit, as well as the fit rms,
averaged across all detectors (CHANELs), is monitored
for central slice24 and border slice1. The parameters
are followed as a function of time and as a function of
ambient temperature (INS.TEMP4.VAL, qc parameter
"temp_ambient"). Only data taken in the WFM-NOAO-N,
WFM-NOAO-E modes and read-out mode (DET.READ.CURNAME)
SCI1.0 are selected.
Scoring&thresholds Wavelength Calibration Fit
The thresholds are used for the Health Check settings - the wavelength
calibrations taken in the WFM-NOAO-N and WFM-NOAO-E modes.
The lower thresholds for number of arc lines used in the fit are
relatively tight to be sensitive to a sudden degradation.
History
| Date |
event |
| February 2014 | wavelength calibrations are taken regularly |
Algorithm Wavelength Calibration Fit
To compute the wavelength solution, arc lines are detected at the
center of each slice (using threshold detection on a S/N image) and
subsequently assigned wavelengths, using pattern matching to identify
lines from the input line catalog.
Flux of the Arc Lines
Flux of each wavelength calibration lamp, of the Ne, Xe, and HgCd lamp is monitored.
QC1_parameters
| FITS key |
QC1 database: table, name |
definition |
class* |
HC_plot** |
more docu |
| QC.WAVECAL.SLICE20.LAMP3.LINES.PEAK.MEAN | muse_wave..slice20_lamp3_peak_mean | [count] Mean peak count level of lines of lamp 3 (Ne) above background in slice20 | HC | | [docuSys coming] |
| QC.WAVECAL.SLICE20.LAMP4.LINES.PEAK.MEAN | muse_wave..slice20_lamp4_peak_mean | [count] Mean peak count level of lines of lamp 4 (Xe) above background in slice20 | HC | | [docuSys coming] |
| QC.WAVECAL.SLICE20.LAMP5.LINES.PEAK.MEAN | muse_wave..slice20_lamp5_peak_mean | [count] Mean peak count level of lines of lamp 5 (HgCd) above background in slice20 | HC | | [docuSys coming] |
| QC.WAVECAL.SLICE20.LAMP3.LINES.PEAK.MAX | muse_wave..slice20_lamp3_peak_max | [count] Peak count level of lines of lamp 3 (Ne) above background in slice20 | HC | | [docuSys coming] |
| QC.WAVECAL.SLICE20.LAMP4.LINES.PEAK.MAX | muse_wave..slice20_lamp4_peak_max | [count] Peak count level of lines of lamp 4 (Xe) above background in slice20 | HC | | [docuSys coming] |
| QC.WAVECAL.SLICE20.LAMP5.LINES.PEAK.MAX | muse_wave..slice20_lamp5_peak_max | [count] Peak count level of lines of lamp 5 (HgCd) above background in slice20 | HC | | [docuSys coming] |
*Class: KPI - instrument performance; HC - instrument health; CAL - calibration quality; ENG - engineering parameter
**There might be more than one. |
Trending
We monitor flux of each MUSE arc lamp: Ne, Xe,
and HgCd, in selected slice20, averaged across all
IFUs. It is in units of electrons (due to FITS
standard regulations 'counts' is used instead).
Scoring&thresholds Flux of the Arc Lines
The thresholds are used only for the lamp_peak_max
parameters. The upper limit is set to warn of possible saturation of
the arc lines.
Although good indicator of the flux extrema, this parameter
may not always be sensitive enough. Since the median tries
to discard all bad (saturated pixels, i.e. with raw ADU>65500) and the
image combination of the 15 exposures has done the same before, it's
much less likely to contain (near-)saturated pixels. Also, often lines
are not saturated over the whole width, because of the poor sampling
on the CCD, and so values ~8000 counts below the 65500 limit naturally
occur, even when lines are saturated. And finally, the saturation may
occur in different slice than slice20 (probably has to do with the
graded AR coating of the CCD and the resulting sensitivity to a given
wavelength).
History
| Date |
event |
| 2016-03-11 | Xe lamp replaced and aligned |
| 2016-05-19 | Ne lamp replaced and aligned |
| 2016-06-05 | HgCd lamp replaced; flux appeared too high, so the exp_time was decreased (from 0.8s to 0.65s), PPRS-065580 |
| 2016-07-02 | Testing lamps with different UIT caused saturation of some HgCd lamp frames(three frames at ~71 ADU) |
| 2017-04-10 | After recent adjustment of the arc lamps and integration times the thresholds were modified |
| 2017-07-15 | Xe lamp was replaced (PPRS-069401) |
| 2017-10-10 | New version of the MUSE pipeline adopted, v.2.2. The number of arc lines used for fitting in AO data decreased; This is because not all the detected arcs are used; Some are dropped from fitting; Scoring thresholds adjusted. |
| 2017-10-22 | Integration time of the Ne arc lamp was reduced by 20% to avoid saturation of the strongest lines (PPRS-070494) |
| 2018-06-18 | HgCd arc lamp was replaced (PPRS-072811) |
| 2018-10-27 | the Pen-ray lamp Xe was replaced (PPRS-074217) |
| 2018-11-27 | Ne lamp was replaced (PPRS-74524) |
Algorithm Flux of the Arc Lines
The maximum flux is defined as a peak of all lines in a given lamp,
in a spectrum that is a median of the three middle CCD rows of
slice20.
|
