Plot
? |
Symb
? |
Source
* |
Average ? |
Thresholds ? |
N_
data |
QC1
parameter |
Data
downloads |
Remarks |
| method |
value |
unit |
method |
value |
| 1 |
• | QC1DB |
none |
|
arcsec |
none | |
2926 |
qc_std_seeing |
this |
last_yr |
all
|
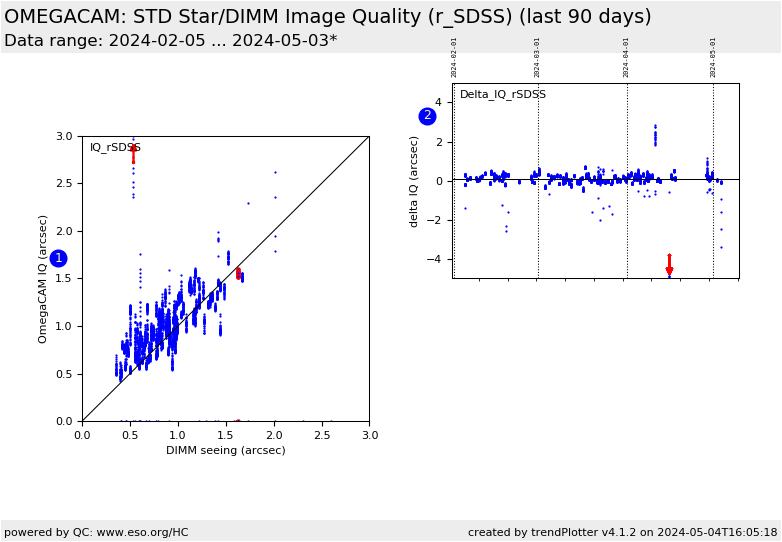
OmegaCAM STD FWHM vs. corrected DIMM seeing (arcsec) for each individual detector with line of equivalence plotted [r_SDSS].
This data set is not scored. |
| 2 |
• | QC1DB |
MEDIAN |
0.12 |
arcsec |
VAL | -2000.0,50. |
2926 |
qc_delta_fwhm |
this |
last_yr |
all
|
delta FWHM = (OmegaCAM STD FWHM - corrected DIMM seeing) (arcsec) [r_SDSS] for each individual detector.
This data set is not scored. |
| |
|
*Data sources: QC1DB: QC1 database; LOCAL: local data source
|
Plot 1
scores: not implemented
| | data source: | omegacam_std
(QC1 database) |
| dataset: | qc_std_seeing | • |
| average: | none |
| thresholds: | none |
| N_data plotted: | 2926 |
| [click plot for closeup] |
Plot 2
scores: not implemented
| | data source: | omegacam_std
(QC1 database) |
| dataset: | qc_delta_fwhm | • |
| median: | 0.12 | arcsec |
| fixed thresholds: | -2000.0...50.0 | arcsec |
| N_data plotted: | 2926 |
| [click plot for closeup] |
Trending plots for the standard star image quality (FWHM) vs. the
seeing as measured by the DIMM site-monitor.
r_SDSS filter.
QC parameters are derived from each of 32 detectors of OmegaCAM STD,ZEROPOINT frames.
DB Name: omegacam_std
Fits header: QC.AMBI.SEEING, QC.STD.SEEING
QC1 DB: qc_ambi_seeing, qc_std_seeing, qc_delta_fwhm
Description:
The FWHM (arcsec) is measured only for sources identified as
stellar (CLASS_STAR >= 0.90 from the SExtractor detection)
and are contained in the pipeline product frame ZEROPOINTS.
The DIMM seeing has been adjusted to the wavelength and airmass of the
standard star observation.
Setup:
BIN.X / BIN.Y / READ.MODE / READ.SPEED / INS.FILT1.NAME = 1/1/normal/normal/r_SDSS
These Health Check plots describe:
Fig. 1 IQ_rSDSS: A one-to-one comparison of the image
quality achieved by OmegaCAM and the seeing as measured by the DIMM (converted to the STD star OB's airmass and waveband).
The plot shows the FWHM of the stars matched from the secondary
standard catalogue and the corrected DIMM values at the moment of
observation plotted against one another (in arcsec). The values for
each of the 32 detectors is shown.
#The most recent data points are marked in magenta.
Fig. 2 Delta_IQ_rSDSS: shows Delta_IQ = OmegaCAM
standard star FWHM - DIMM seeing for all 32 detectors.
This parameter is scored.
Fig. 3 score_outliers: Scores of the r_SDSS
Delta_IQ_rSDSS values as measured for each of the 32 detectors.
Green = within the defined thresholds.
Red = beyond the defined thresholds.
OmegaCAM detector plane layout (detector_ID locations):

General information
Click on any of the plots to see a close-up version.
The latest date is indicated on top of the plot.
If configured,
- data points belonging to the latest date are specially marked
- statistical averages are indicated by a solid line, and thresholds by broken lines
- outliers are marked by a red asterisk. They are defined as data points outside the
threshold lines
- "aliens" (= data points outside the plot Y limits) are marked by a red arrow (↑ or ↓)
- you can download the data for each parameter set if the 'Data downloads' link shows up
|
