Plot
? |
Symb
? |
Source
* |
Average ? |
Thresholds ? |
N_
data |
QC1
parameter |
Data
downloads |
Remarks |
| method |
value |
unit |
method |
value |
| 1 |
• | QC1DB |
MEAN |
-22.2 |
pixels |
VAL | -200.,200. |
726 |
qc_deltax_shift |
this |
last_yr |
all
|
WCS shift in X direction averaged over all CCDs |
| 2 |
• | QC1DB |
MEAN |
39.1 |
pixels |
VAL | -200.,200. |
726 |
qc_deltay_shift |
this |
last_yr |
all
|
WCS shift in Y direction averaged over all CCDs |
| |
|
*Data sources: QC1DB: QC1 database; LOCAL: local data source
|
Plot 1
scores:  69| 69|
| | data source: | omegacam_std
(QC1 database) |
| dataset: | qc_deltax_shift | • |
| mean: | -22.2 | pixels |
| fixed thresholds: | -200.0...200.0 | pixels |
| N_data plotted: | 726 |
| [click plot for closeup] |
Plot 2
scores: 69|
| | data source: | omegacam_std
(QC1 database) |
| dataset: | qc_deltay_shift | • |
| mean: | 39.1 | pixels |
| fixed thresholds: | -200.0...200.0 | pixels |
| N_data plotted: | 726 |
| [click plot for closeup] |
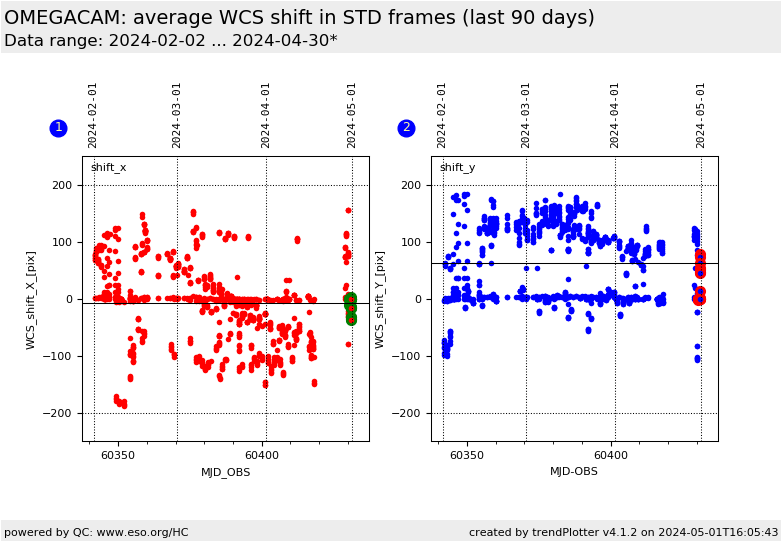
Trending plots for WCS shift from standard star observations.
QC parameters are derived from each of 32 detectors of OmegaCAM STD
frames. Data in all filters, excluding composite filter u_g_r_i_SDSS,
are combined in this plot.
DB Name: omegacam_std
Fits header: QC.DELTAX.SHIFT / QC.DELTAY_SHIFT
QC1 DB: qc_deltax_shift / qc_deltay_shift
Description:
The WCS shift in the STD observations measured in X and
Y-direction [pix].
These Health Check plots describe:
Fig. 1
shift_x: The WCS shift in X direction averaged over all 32
detectors [pix].
Fig. 2 shift_y: The WCS shift in Y direction averaged over all 32
detectors [pix].
OmegaCAM detector plane layout (detector_ID locations):

General information
Click on any of the plots to see a close-up version.
The latest date is indicated on top of the plot.
If configured,
- data points belonging to the latest date are specially marked
- statistical averages are indicated by a solid line, and thresholds by broken lines
- outliers are marked by a red asterisk. They are defined as data points outside the
threshold lines
- "aliens" (= data points outside the plot Y limits) are marked by a red arrow (↑ or ↓)
- you can download the data for each parameter set if the 'Data downloads' link shows up
|
