| This documentation is intended both for QC scientists and SciOps astronomers (who may want to ignore the technical information displayed in grey). | ||||||||||||||||||||||||||||
|
||||||||||||||||||||||||||||
|
||||||||||||||||||||||||||||
| bottom plots | contact | ||||||||||||||||||||||||||||
| NAME | QCsinfo_wave.py | |||||||||||||||||||||||||||
| VERSION |
1.0 -- 2006-06-21 fill template by handbook 1.1 -- 2006-07-07 certified 2.0 -- 2009-01-01 completely re-written (from scratch) in Python 4.0 -- 2010-03-01 over-hauled with added QC functions and images (for e.g. spectral resolution and arc line position dispersions). | |||||||||||||||||||||||||||
| SYNTAX | Python | |||||||||||||||||||||||||||
| CALL |
measureQuality from $DFS_PRODUCT/WAVE/$DATE: QCsinfo_wave.py -a $AB -i 1 | |||||||||||||||||||||||||||
| INSTRUMENT | SINFONI | |||||||||||||||||||||||||||
| RAWTYPE | WAVE | |||||||||||||||||||||||||||
| PURPOSE |
a) generates QC report b) writes QC1 parameters into local database | |||||||||||||||||||||||||||
| PROCINPUT |
No input is required: a) $DATE is now read from AB b) primary file is set in QCsinfo_wave.py and is the PRO.CATG=WAVE_MAP product with the _0000.fits extension. c) The remaining required raw frames are implicitly read from the AB. d) They include products such as WAVE_MAP, WAVE_LAMP_STACKED, WAVE_COEF_SLIT, WAVE_FIT_PARAMS, SLIT_POS, and RESAMPLED_WAVE are used and implicitly read. e) Reference WAVE_LAMP_STACKED, RESAMPLED_WAVE, WAVE_COEF_SLIT, and WAVE_MAP are read from $DFO_QC_DIR/references/WAVE. | |||||||||||||||||||||||||||
| QC1TABLE |
trending | table(s) in QC1 database: sinfoni_wave | |||||||||||||||||||||||||||
| TRENDPLOT |
trending | HealthCheck plot(s) associated to this procedure: trend_report_WAVE_length_HC.html | |||||||||||||||||||||||||||
| QC1PAGE |
trending | associated documentation: wave_QC1.html | |||||||||||||||||||||||||||
| QC1PLOTS top |
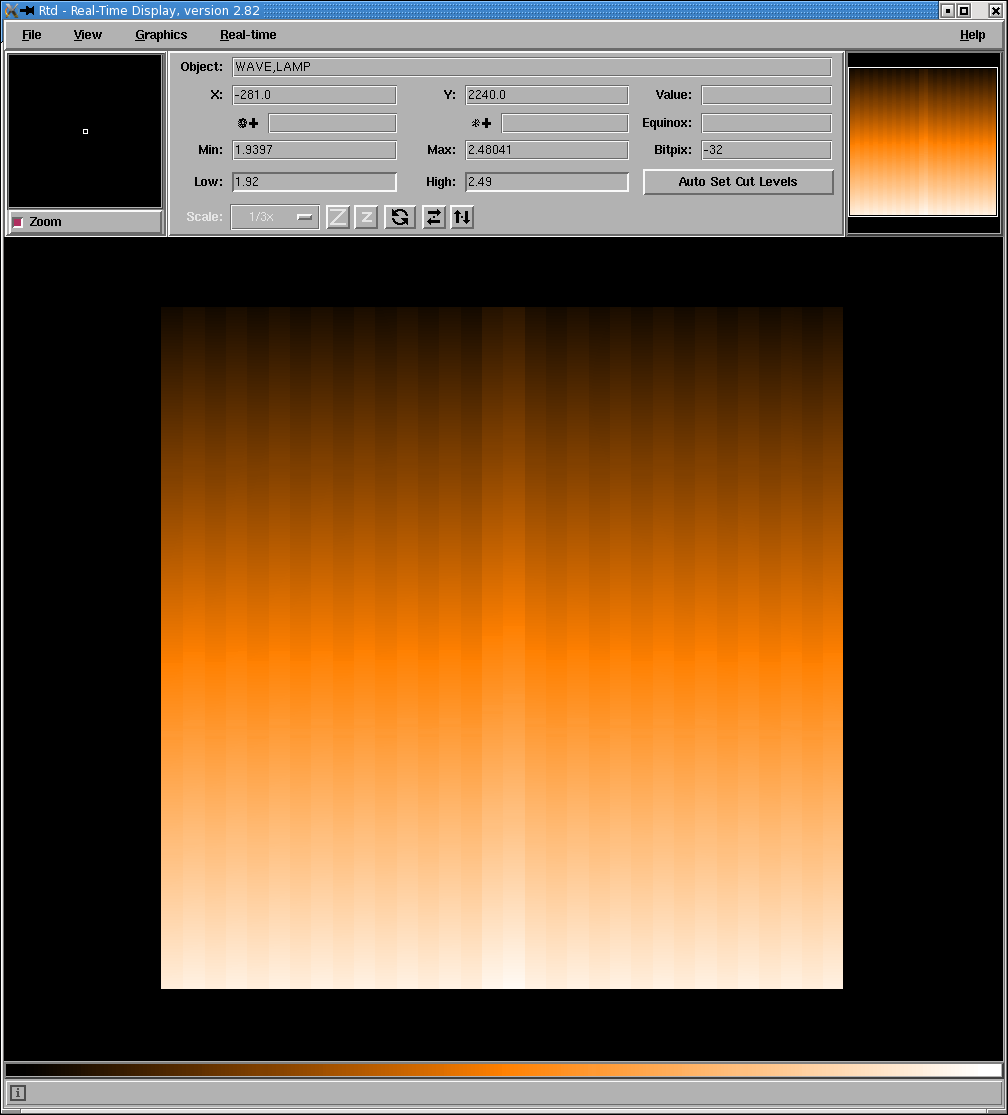
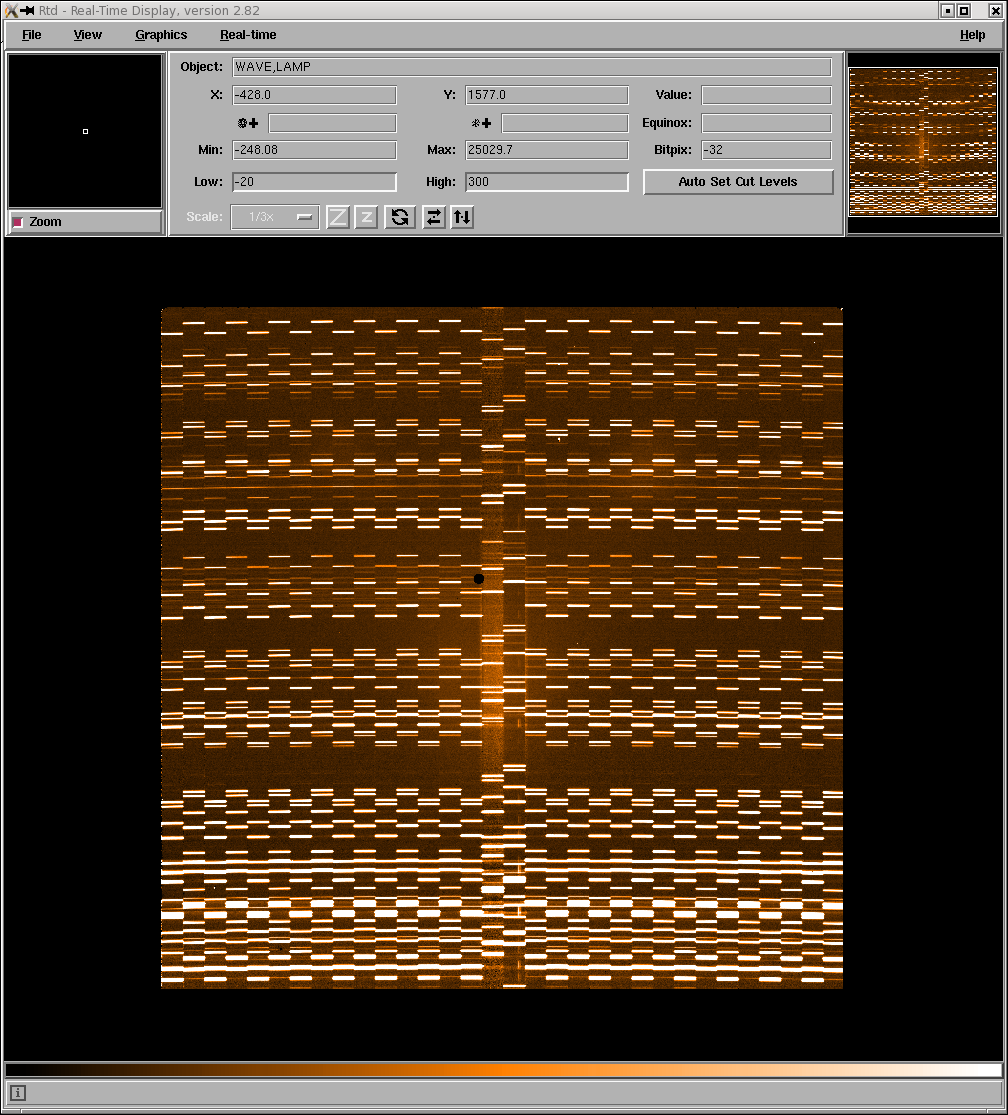
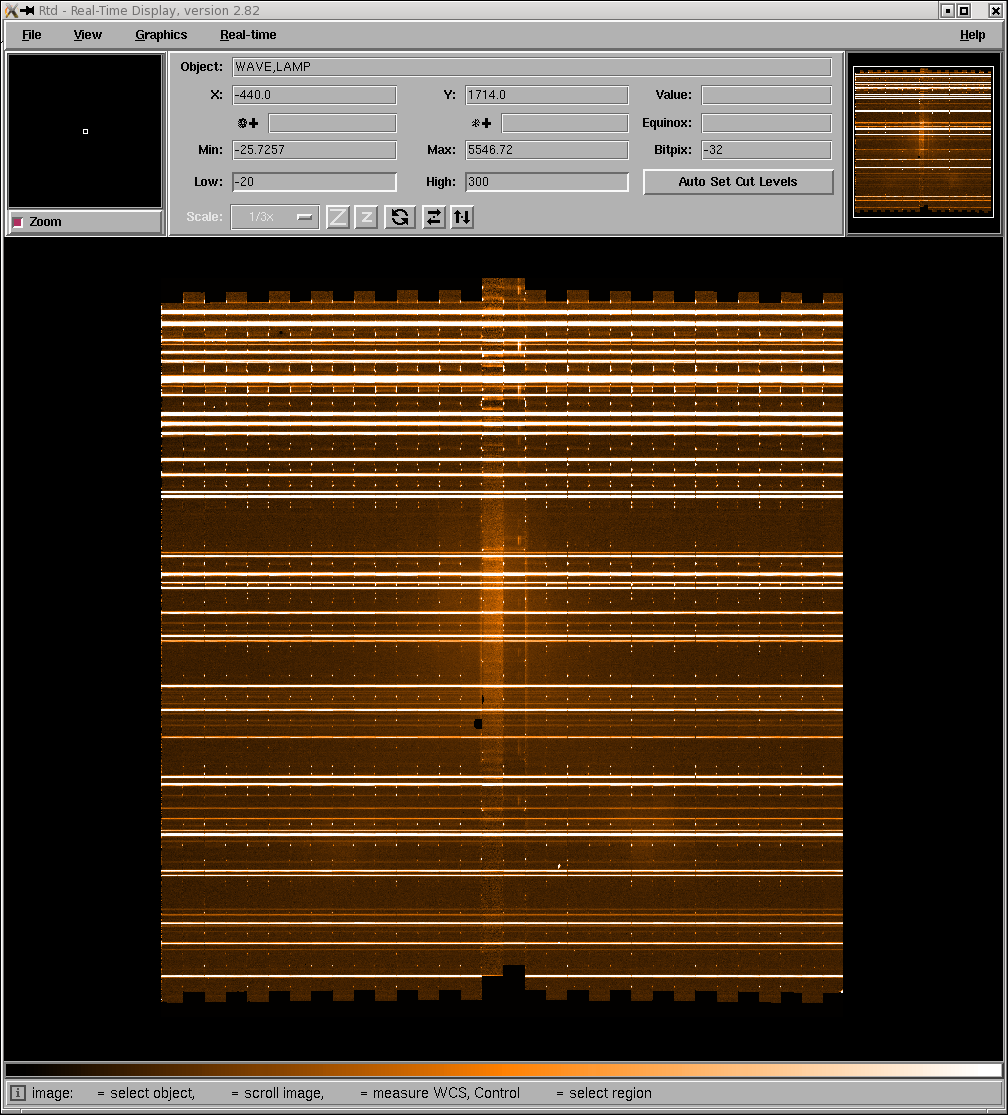
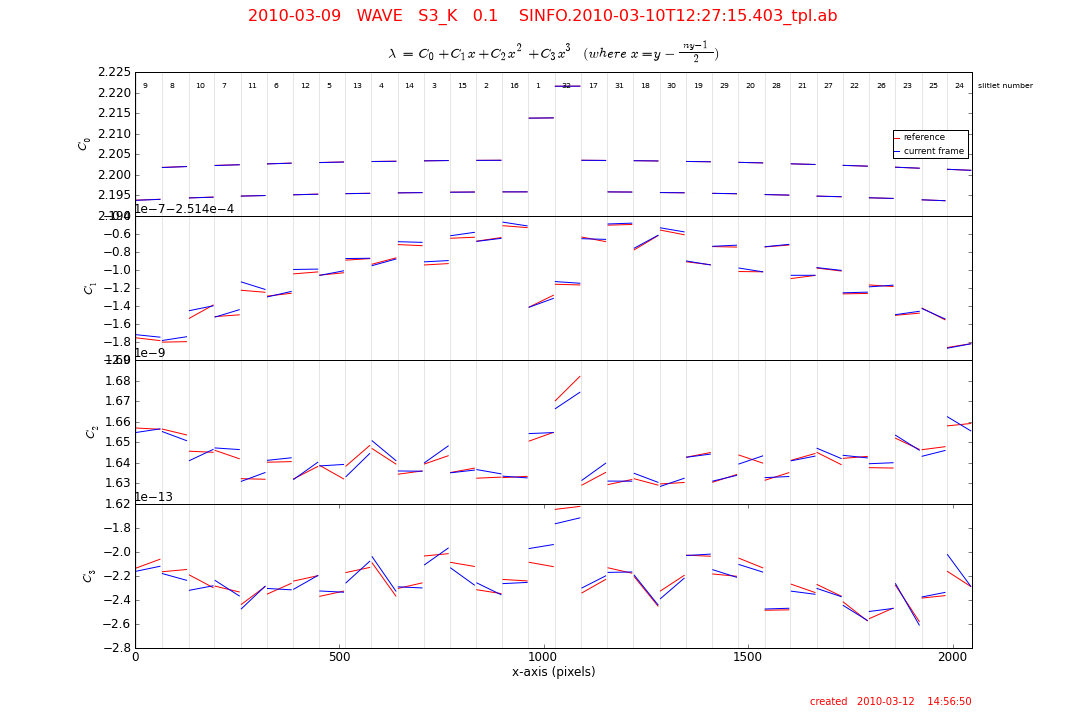
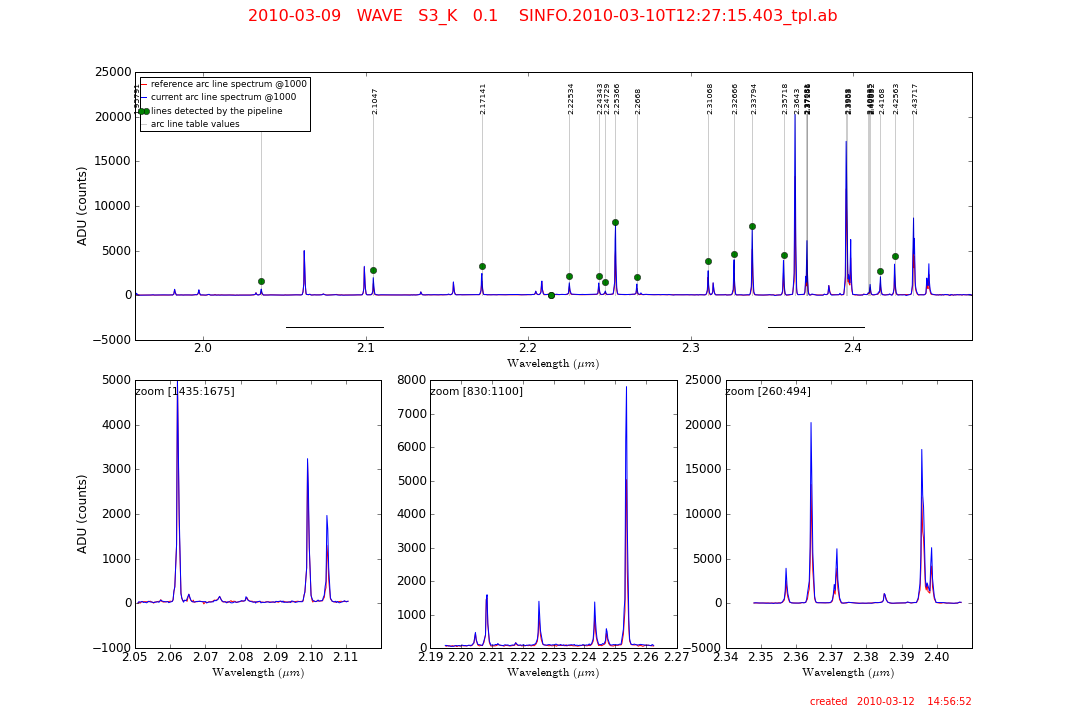
wave1.png display WAVE_MAP (the 2-d wavelength solution) on the Real Time Display wave2.png display WAVE_LAMP_STACKED (the full-frame arc lamp image, uncorrected) on the Real Time Display wave3.png display RESAMPLED_WAVE (the full-frame arc lamp image, corrected) on the RealTime Display wave4.png QC Report 1: UL : the current RESAMPLED_WAVE product image. UC : the reference RESAMPLED_WAVE product image. UR : the difference between the reference and the current RESAMPLED_WAVE image. The full range of the difference image is given by the colour bar which, unfortunately, reduces the size of the displayed image (this is a matplotlib bug). LR : the current WAVE_MAP product image. LC : the reference WAVE_MAP product image. UR : the difference between the reference and the current WAVE_MAP image. The full range of the difference image is given by the colour bar which, unfortunately, reduces the size of the displayed image (this is a matplotlib bug). wave5.png QC Report 2: A four figure plot showing the coefficients computed for the wavelength solution. The coefficients are defined for each row (y-axis) such that: lambda = C0 + C1*x + C2*x^2 + C3*x^3 (where x = y - (Ny-1)/2). The current coefficient values are plotted for each slitlet and depicted in blue. The reference coefficient values are shown in red. top : 0th coefficient C0. top center : 1st coefficient C1. lower center : 2nd coefficient C2. bottom : 3rd coefficient C3. wave6.png QC Report 3: Plots of the extracted, calibrated arc line spectrum. The current arc spectrum is shown in blue and the reference spectrum is plotted in red. top: The full range arc line spectrum extracted along column pixel 1000. Green dots show arc lines detected by the SINFONI pipeline. All emission lines contained in the arc line table are labelled. LL: Zoomed region of the arc line spectrum. The pixel values of the zoom are given in the top left corner of the frame and the zoom region is shown as a horizontal line in the upper full-scale plot. LC: Zoomed region of the arc line spectrum. As above. LR: Zoomed region of the arc line spectrum. As above. wave7.png QC Report 4: top: The spectral resolution (R) as a function of wavelength. The spectral resolution is computed for each arc line detected by the pipeline. The median spectral resolution is shown as a blue dotted line with blue shading indicating +/-1 standard deviation. The nominal spectral resolution (as given by the SINFONI User's manual pg. 65), for the given grism and pixel scale, is indicated by a thick green line. Both are written to the top left of the plot. center: The arc line residuals are computed from the positional differences between the computed arc line positions and the positions given by the arc line table. The residuals are plotted in units of pixels, and the median value is shown as a dotted blue line with blue shading indicating +/-1 standard deviation. bottom: The non-linear wavelength conversion terms. The non-linear terms are given by: lambda - lambda(NL) = -(C2*x^2 + C3*x^3) (where x = y - (Ny-1)/2). The blue line indicates the current frame, while the red line shows the non-linear terms of the reference wavelength solution. | |||||||||||||||||||||||||||
| QC1PARAM |
QC1 parameters written into QC1 table (sinfoni_wave):SOURCE(header/script) DBNAME value description | |||||||||||||||||||||||||||
| ALGORITHM |
Description of algorithms: qc_coef0_avg .. qc_coef2_med: For each of the 2048 columns an individual wavelength dispersion solution is found, and specified by four coefficients per column. The median and the average over the 2048 coefficients is given. qc_fwhm_avg: The average full width at half maximum of the sample of arc lines (in pixels) qc_fwhm_med: The median full width at half maximum of the sample of arc lines (in pixels) qc_slit17_x: The slitlet position value of slitlet #17 taken from the SLIT_POS product table qc_wave_poserr: The overall quality of the dispersion solution fit qc_frmon_meanflux .. qc_frmdif_maxflux: A set of simple QC1 parameters comparing the lamp-on and lamp-off frames qc_frmon_npixsat: The number of saturated pixels qc_spec_res_med: The spectral resolution is computed for each arc line detected and the median is computed qc_spec_res_std: The standard deviation of the spectral resolution computed for each arc line detected qc_arcline_resid_med: The median difference between the detected arc lines and the values in the arc line table qc_arcline_resid_std: The standard deviation of the difference between the detected arc lines and the values in the arc line table | |||||||||||||||||||||||||||
| CERTIF |
Reasons for rejection: The calibration template requests user-interaction (initialization of the grating, moving it to the desired position) in the case that a grating time-out occurs in order to avoid a possible grating wheel stuck problem. If the difference frames (current product minus reference product) show obvious, strong changes in current data. The RESAMPLED_WAVE product has the wavelength correction applied to the full arc lamp frame. If there are obvious jumps between the horizontal arc lines (at the junctions of the slitlets) then this warrants investigation. | |||||||||||||||||||||||||||
| COMMENTS | ||||||||||||||||||||||||||||
| top | [2015-10-30T08:20:41] created by qcDocu v1.1.2, a tqs tool | |||||||||||||||||||||||||||