| This documentation is intended both for QC scientists and SciOps astronomers (who may want to ignore the technical information displayed in grey). | |||||||||||||||||||||||||||||
|
|||||||||||||||||||||||||||||
|
|||||||||||||||||||||||||||||
| bottom plots | contact | |||||||||||||||||||||||||||||
| NAME | qc_DETMON.sh | ||||||||||||||||||||||||||||
| VERSION |
1.0 -- 2012-06-04 copied from qc_DARK 2.0 -- 2016-04-11 modified 2.1 -- 2017-07-20 modified 2.2 -- 2017-08-30 docu reviewed 2.3 -- 2017-10-10: X0(Fowlersampling) (transition point) = 14 (before it was at DIT=10sec) | ||||||||||||||||||||||||||||
| SYNTAX | SHELL | ||||||||||||||||||||||||||||
| CALL |
processQC from $DFS_PRODUCT/qc_DETMON/$DATE: qc_DETMON $date $primfile " | ||||||||||||||||||||||||||||
| INSTRUMENT | NACO | ||||||||||||||||||||||||||||
| RAWTYPE | DETMON | ||||||||||||||||||||||||||||
| PURPOSE | 1) calculate the offset of the photon transfer curve since the detmon recipe does not deliver this parameter 2) calls the QC detmon python (qclib) 3) using the raw flat data and calculate the saturation level 4) generate a QC report for the saturation level | ||||||||||||||||||||||||||||
| PROCINPUT |
DET_LIN_INFO product; | ||||||||||||||||||||||||||||
| QC1TABLE |
trending | table(s) in QC1 database: naco_detmon | ||||||||||||||||||||||||||||
| TRENDPLOT |
trending | HealthCheck plot(s) associated to this procedure: trend_report_DETMON_COUNTS_HC.html | trend_report_DETMON_LIN_HC.html | trend_report_DETMON_GAIN_HC.html | ||||||||||||||||||||||||||||
| QC1PAGE |
trending | associated documentation: detmon_qc1.html | ||||||||||||||||||||||||||||
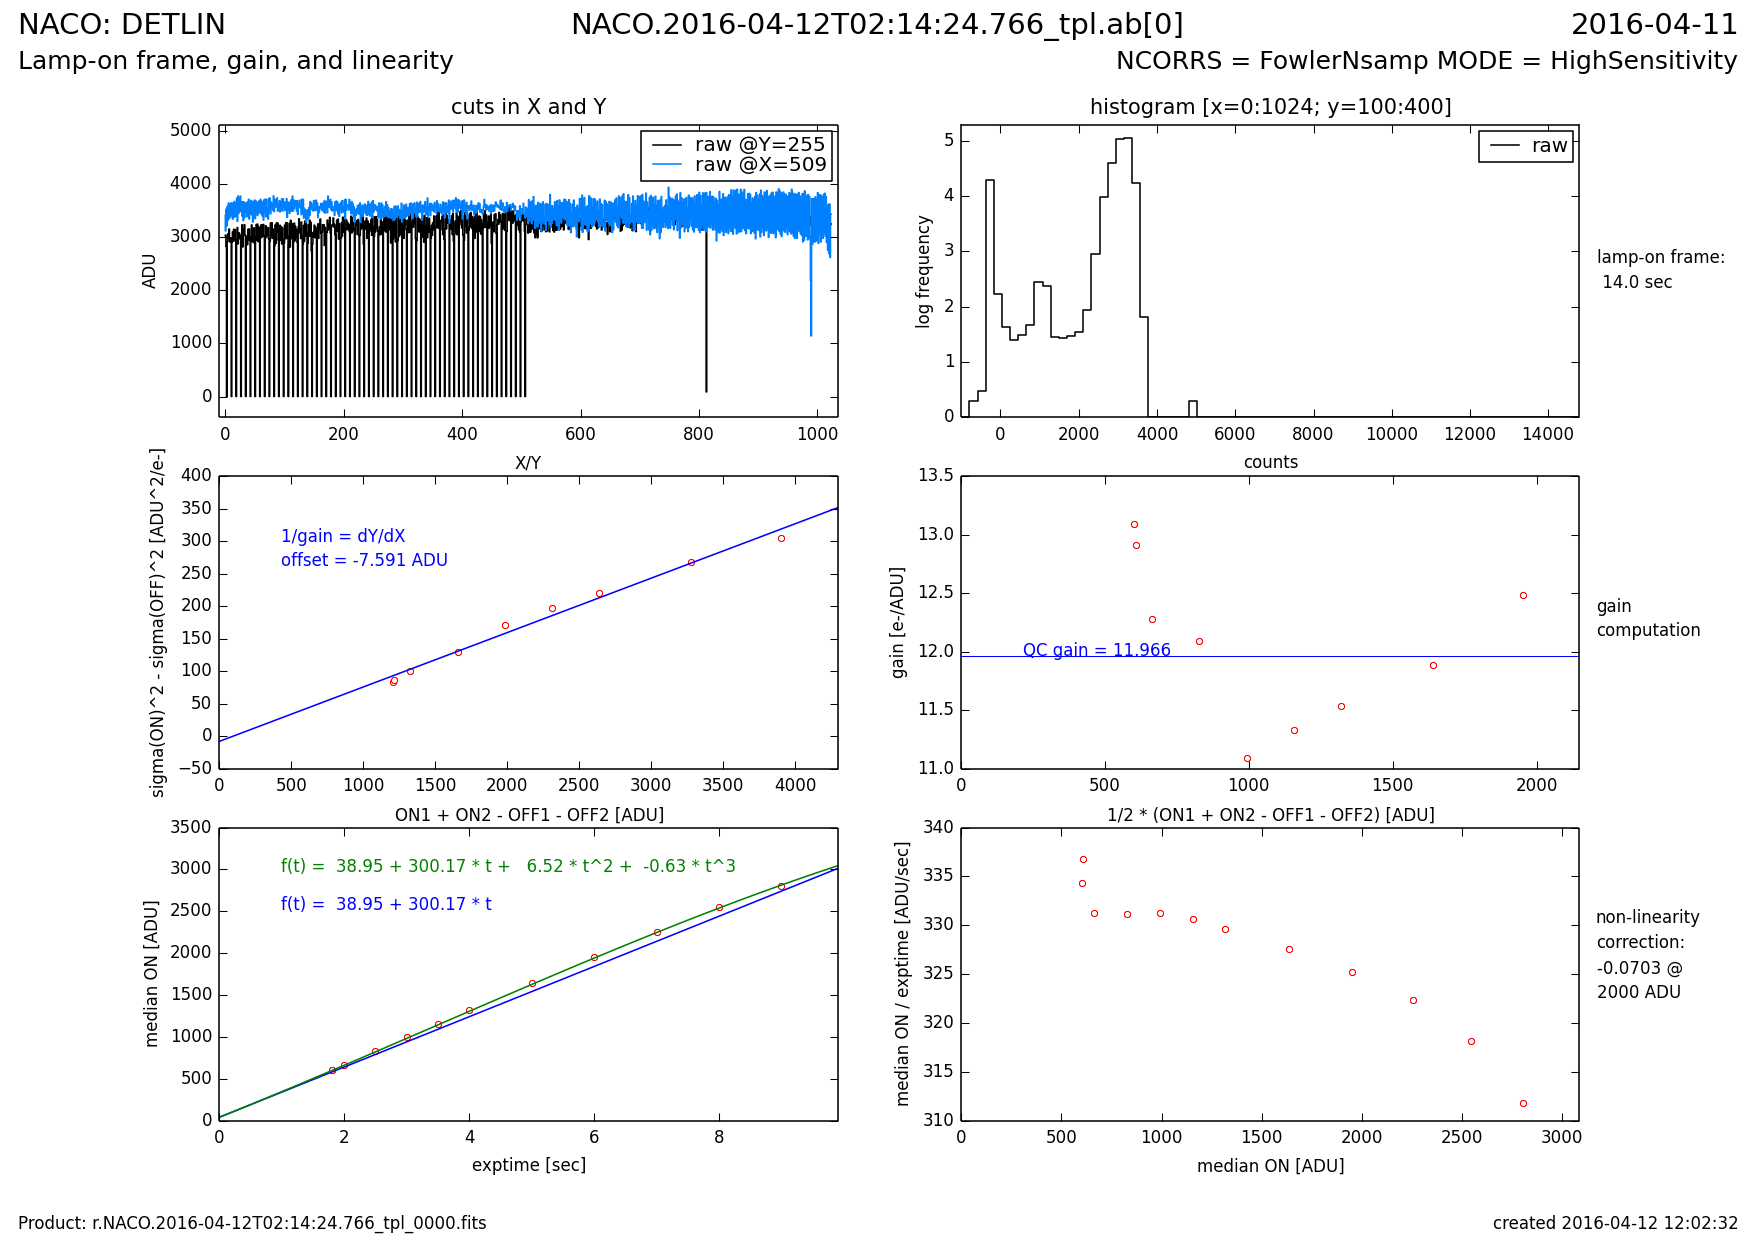
| QC1PLOTS top |
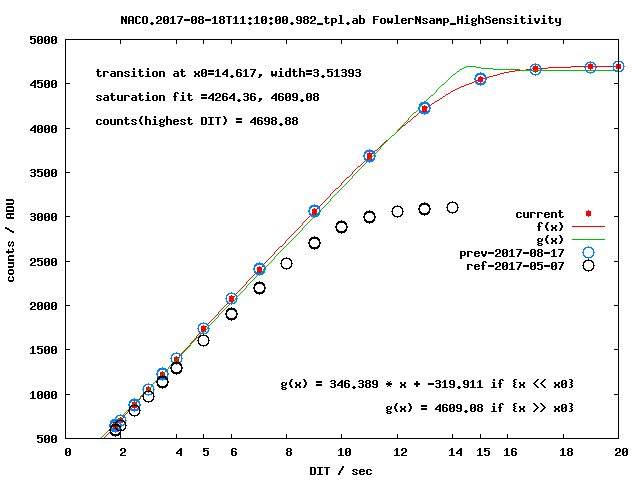
qc_detmon1.png standard detmon QC report, UL: cross section of brightest flat UR: histogram of brighest flat with sharp edge at saturation level CL: photon trasnfer curve: slope is 1/gain. The offset is derived from the QC script. CR: gain from PTC (blue) and from individual flat pairs (red). LL: counts/sec, ramp-up, linear and non-linear fit. LR: non-linearity expression in a deviation from the mean lamp flux / [ADU/sec]. qc_detmon2.png This plot shows the median counts of the current raw flats (black circles) and two arithmetic functions fit to the data. (green line) f(x) = [1/2 - atan((x-x0)/s)] * (a+b*x) + [1/2 + atan((x-x-)/s)] * c. For x < < x0, the left []-bracket = 1 and the right []-bracket = 0 and the linear function a+b*x dominates, for x > > x0, the left []-bracket = 0 and the right []-bracket = 1 and the constant c dominates. This composed function f(x) fits the linear part at low DIT and the constant (saturation part) at high DIT. a,b,c, and x0=transition point and s=transition width are best fit parameters. Fit parameter c has the meaning of the detector well depth if s < < maxDIT. (green line) g(x) is f(x) applied with x0=x0, s=s/5 and varying a,b,c only. g(x) forces a small with 's' resulting in a better 'c'. | ||||||||||||||||||||||||||||
| QC1PARAM |
QC1 parameters written into QC1 table: QC1db names: linearity, gain | ||||||||||||||||||||||||||||
| ALGORITHM |
Description of algorithms: See detector monitoring generic pipeline user manual | ||||||||||||||||||||||||||||
| CERTIF | NONE | ||||||||||||||||||||||||||||
| COMMENTS |
Since the detector full well depth (the saturation level) can change, special care must be taken. The counts in the brighest flat of template can differ from the saturation level of the detector. It also differs from the brighest flat not rejected by the linearity algorithm and the brightest flat not rejected by the gain algorithm. | ||||||||||||||||||||||||||||
| top | [2017-09-13T12:46:24] created by qcDocu v1.1.2, a tqs tool | ||||||||||||||||||||||||||||