| This documentation is intended both for QC scientists and SciOps astronomers (who may want to ignore the technical information displayed in grey). | ||||||||||||||||||||||||||||
|
||||||||||||||||||||||||||||
|
||||||||||||||||||||||||||||
| bottom plots | contact | ||||||||||||||||||||||||||||
| NAME | QCsinfo_sci.py and QCsinfo_persist.py (for the persistence check) | |||||||||||||||||||||||||||
| VERSION | 2.0 -- 2009-07-02 completely re-written in Python with added QC functions and images | |||||||||||||||||||||||||||
| SYNTAX | Python | |||||||||||||||||||||||||||
| CALL |
measureQuality from $DFS_PRODUCT/OBSNOD/$DATE/ or $DFS_PRODUCT/OBSJIT/$DATE/ QCsinfo_sci.py -a $AB -i 1 | |||||||||||||||||||||||||||
| INSTRUMENT | SINFONI | |||||||||||||||||||||||||||
| RAWTYPE | OBSNOD and OBSJIT | |||||||||||||||||||||||||||
| PURPOSE |
a) generates QC reports | |||||||||||||||||||||||||||
| PROCINPUT |
No input is required: a) $DATE is now read from AB b) primary file is set in QCsinfo_sci.py and is the PRO.CATG=COADD_OBJ product with the _0000.fits extension. c) raw frames are implicitly read from the AB. d) other products such as MED_COADD_OBJ, and OBJECT_NODDING_STACKED are used and implicitly read. | |||||||||||||||||||||||||||
| QC1TABLE |
trending | table(s) in QC1 database: sinfoni_sci | |||||||||||||||||||||||||||
| TRENDPLOT |
trending | HealthCheck plot(s) associated to this procedure: trend_report_SCI_persist_HC.html | |||||||||||||||||||||||||||
| QC1PAGE |
trending | associated documentation: sci_QC1.html | |||||||||||||||||||||||||||
| QC1PLOTS top |
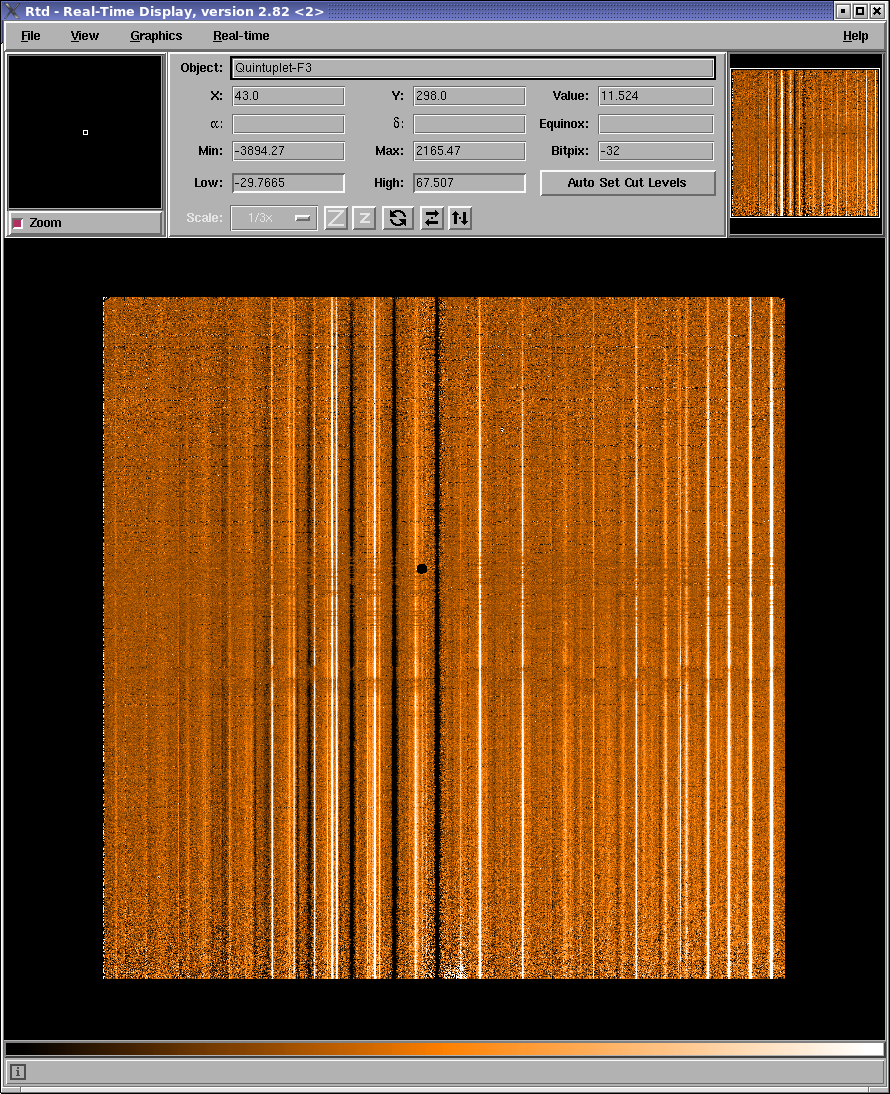
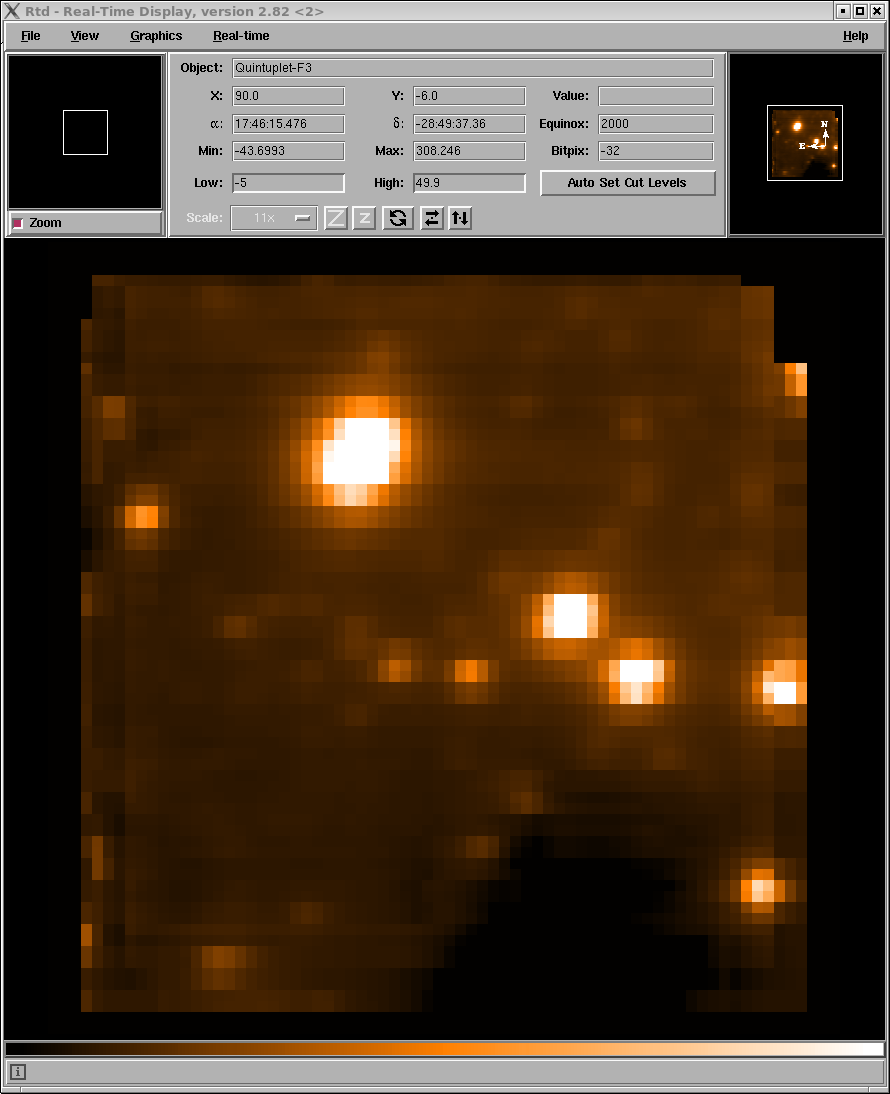
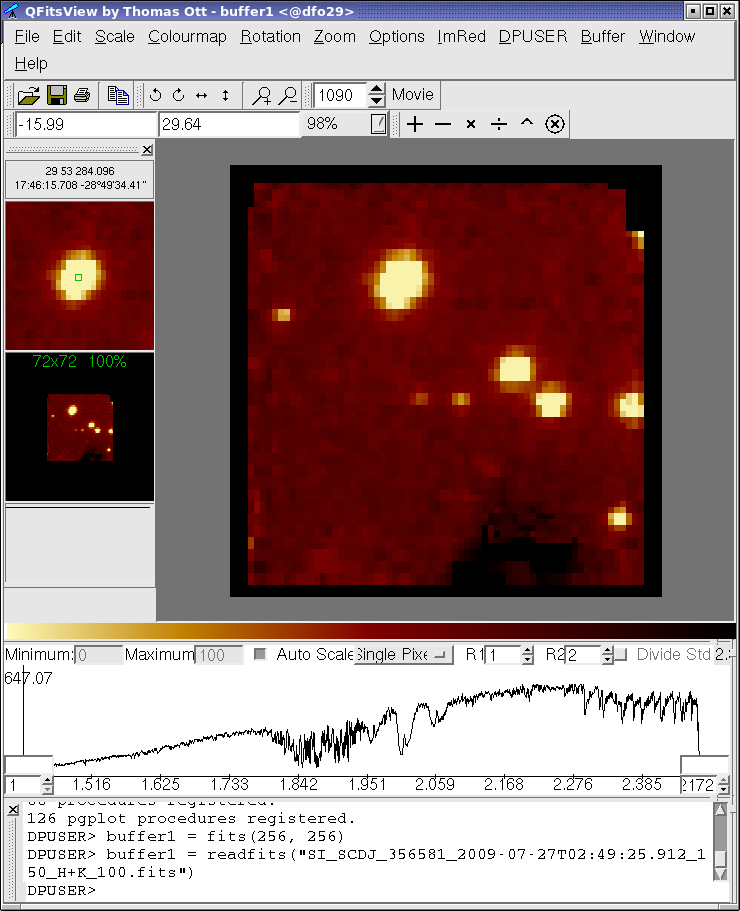
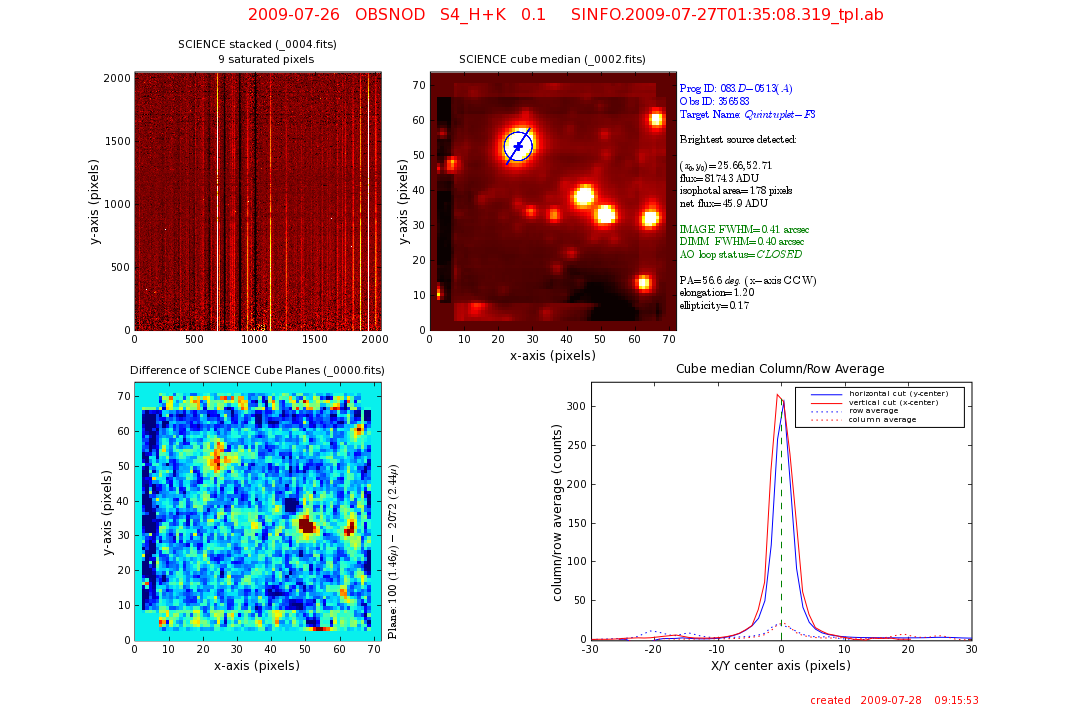
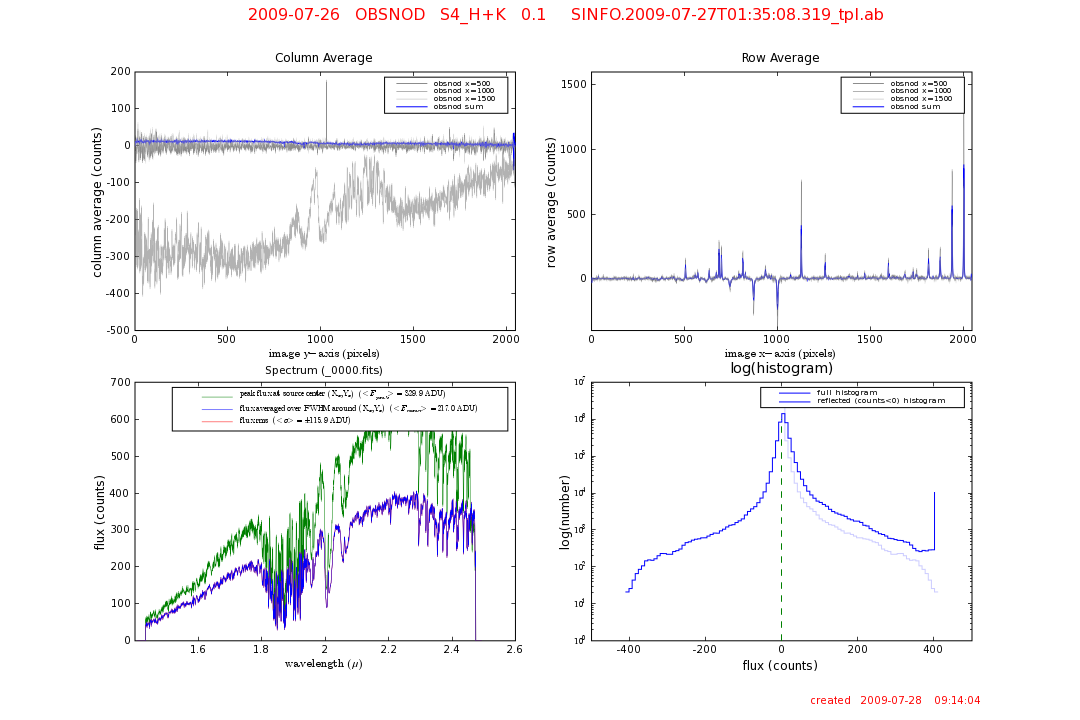
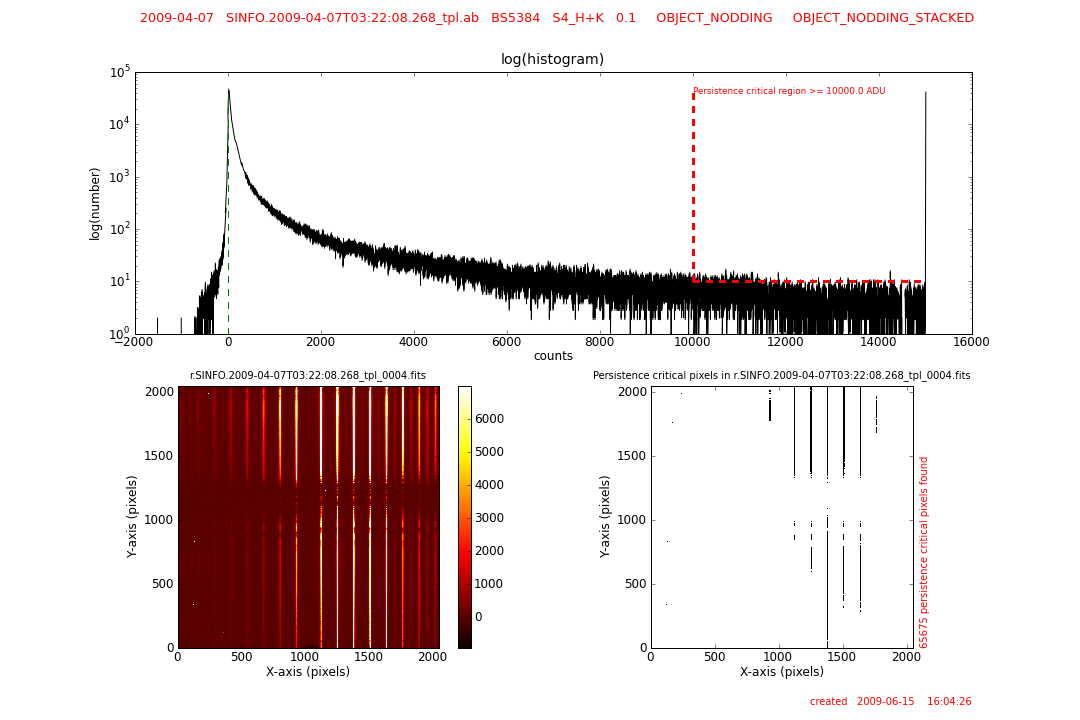
sci1.png display the OBJECT_NODDING_STACKED full detector intermediate product on the Real Time Display sci2.png display MED_COADD_OBJ product on the Real Time Display sci3.png display 3-d sciece cube product COADD_OBJ on the QFitsView display sci4.png QC Report 1: UL: the OBJECT_NODDING_STACKED full detector intermediate science image with the number of saturated pixels listed. UR: the MED_COADD_OBJ median cube collapsed science image. A number of paramters are listed: the Program ID, the Obs ID, the target name, the time and AM difference between the science OB and its associated telluric STD, and for the brightest source detected: source center (pixels), the integrated flux (within 3 sigma), the isophotal area (3 sigma), the net flux per pixel, the image FWHM (arcsec), the DIMM seeing corrected for the same airmass and filter used by this standard star, the status of the AO loop (OPEN or CLOSED), the position angle of the brightest source (degrees CCW from the x-axis), and its elongation and ellipticity. The source center, its position angle, and its FWHM are marked on the image. NOTE: The conversion from pixels to arcsec in the FWHM takes into account the fact that the reconstructed SINFONI cube has RECTANGULAR pixels such that on-sky Delta_X = 0.5*Delta_Y. The correct conversion, in terms of the source position angle (PA), is: FWHM(arcsec) = FWHM(pixels) * pixel_scale * sqrt[(0.5*cos(PA))**2 + (sin(PA))**2]. LL: the (scaled) difference between two cube planes. Plane 100 - Plane 2072. The wavelengths of these planes are listed to the right of this image. LR: a horizontal (blue line) and vertical (red line) cut through the center of the brightest detected source of the MED_COADD_OBJ median cube collapsed science image. The respective averages through this center are shown as dotted lines. sci5.png QC Report 2: UL: three single column traces of the current product (OBJECT_NODDING_STACKED) through: x = 500 (dark grey) x = 1000 (middle grey) x = 1500 (light grey) and an averaged sum of all columns (blue). UR: three single row traces of the current product (OBJECT_NODDING_STACKED) through: x = 500 (dark grey) x = 1000 (middle grey) x = 1500 (light grey) and an averaged sum of all rows (blue). LL: the background-subtracted spectrum of the brightest science source. This spectrum is computed by the post-pipeline script QCsinfo_sci.py. The green line is the peak flux extracted from each cube plane at the position of the brightest source, whereas the blue line is the average flux over the FWHM measured for the brightest source. The red line is an estimate of the flux rms. LR: a logarithmic histogram of the OBJECT_NODDING_STACKED full detector image is shown as a dark blue line, while the reflection of the non-positive flux histogram is shown in light blue. persist.png Only if an over-flux is detected is another report created: QC Report 3: top: a logarithmic histogram of the OBJECT_NODDING_STACKED full detector science image with the persistence critical region shown as a red dotted line. LL: the STD_NODDING_STACKED full detector intermediate product image. LR: an estimate of the location of possible persistence critical pixels. | |||||||||||||||||||||||||||
| QC1PARAM |
QC1 parameters written into QC1 table (sinfoni_sci):SOURCE(header/script) DBNAME value description | |||||||||||||||||||||||||||
| ALGORITHM |
Description of algorithms: (status 2009-07-30) RTC QC parameters: special AO software QC.FRM parameters : simple statistics on the final product cube QC.FWHM parameters : Gauss fit integrated into the pipeline; QC1 parameter inventory TBD X,Y position, flux, and FWHM parameters : the post-pipeline script (QCsinfo_sci.py) runs SExtractor (Bertin and Arnouts 1996 A&A 117,393) and writes these parameters for the brightest source detected. The strehl median and sigma values are first filtered for erroneous values produced by the pipeline. DIMM and sinfoni FWHM parameters : The header keywords TEL.AMBI.FWHM.START and TEL.AMBI.FWHM.END store the DIMM seeing measurements (at 0.5 microns and at the zenith) at the beginning and end of the STD exposure. The average of these two values is computed and converted to the same airmass and wavelength as the respective telluric standard, and also include a correction for an 8m aperture using the relation given in (Sarazin, M. 2000, Astronomical Site Monitor, VLT.SPE.ESO.17410.1174) (QCsinfo_sci.py). Persistence test : the post-pipeline script (QCsinfo_persist.py) tests the OBJECT_NODDING_STACKED full detector image for instances of 6 or more pixels (to select against cosmic ray events) having flux levels greater than 10,000 ADU. If 10 or more such events are discovered an over-flux alarm is given (qc_persist_danger = 1). The number of affected pixels satisfying the above criteria are given by qc_Npersist. | |||||||||||||||||||||||||||
| CERTIF |
Tolerated: - stars in sky frame - strong skew of spectrum Science OB down-graded: - if observed source has saturated flux levels - if strong persistence from previous science, PSF, or telluric STD star observations exists in current science frame - if the difference in time between the science observation and its associated telluric standard star is greater than 1 day - if the difference in airmass between the science observation and its associated telluric standard is greater than 1 | |||||||||||||||||||||||||||
| COMMENTS | None | |||||||||||||||||||||||||||
| top | [2015-10-30T08:24:09] created by qcDocu v1.1.2, a tqs tool | |||||||||||||||||||||||||||