| This documentation is intended both for QC scientists and SciOps astronomers (who may want to ignore the technical information displayed in grey). | ||||||||||||||||||||||||||||
|
||||||||||||||||||||||||||||
| bottom plots | contact | ||||||||||||||||||||||||||||
| NAME | vimos_stdimg.py | |||||||||||||||||||||||||||
| VERSION |
1.0 -- edited from vimos_stdimg.py (March 2010) 1.0.1 -- different scaling for qc_imadisp (2010-03-30) 1.0.2 -- adapted scaling for qc_imadisp (2010-04-15) 1.0.3 -- skip call of scoreQC (2011-05-31) 1.0.4 -- create cover sheet (2011-09-01) 1.0.5 -- QC parameter mode_ellipticity introduced (2011-09-15) | |||||||||||||||||||||||||||
| SYNTAX | PYTHON | |||||||||||||||||||||||||||
| CALL |
processQC from $DFS_PRODUCT/SCI_IMG_STARE/$DATE /home/vimos/python/vimos_sciimg.py -i -a $AB | |||||||||||||||||||||||||||
| INSTRUMENT | VIMOS | |||||||||||||||||||||||||||
| RAWTYPE | SCI_IMG_STARE | |||||||||||||||||||||||||||
| PURPOSE | QC check of raw and product science imaging | |||||||||||||||||||||||||||
| PROCINPUT |
reduced science image IMG_SCIENCE_REDUCED, table of found objects IMG_GALAXY_TABLE, raw frame | |||||||||||||||||||||||||||
| QC1TABLE |
trending | table(s) in QC1 database: vimos_sci_img | |||||||||||||||||||||||||||
| TRENDPLOT |
trending | HealthCheck plot(s) associated to this procedure: trend_report_IQ_HC.html | trend_report_IQ_UB_HC.html | trend_report_IQ_VR_HC.html | trend_report_IQ_I_HC.html | |||||||||||||||||||||||||||
| QC1PAGE |
trending | associated documentation: imagequality.html | |||||||||||||||||||||||||||
| QC1PLOTS top |
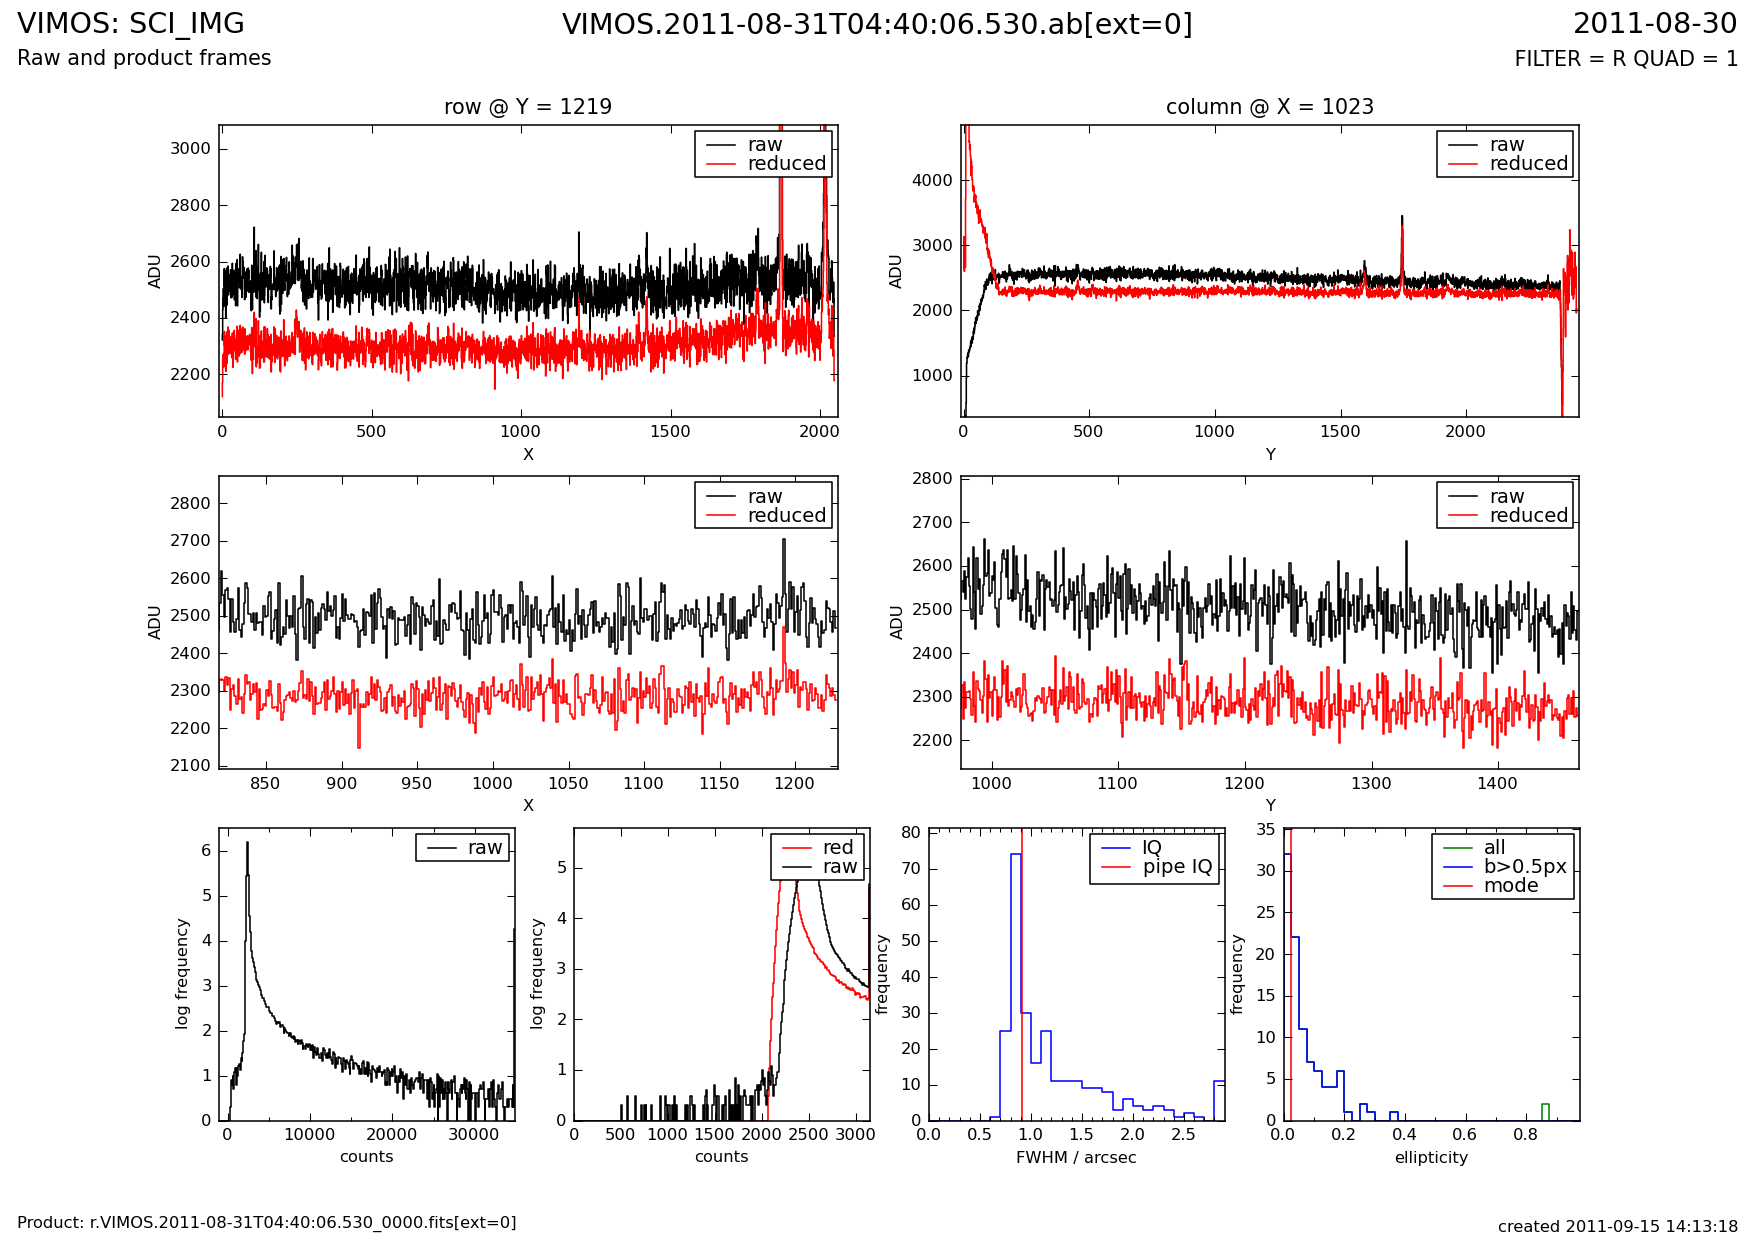
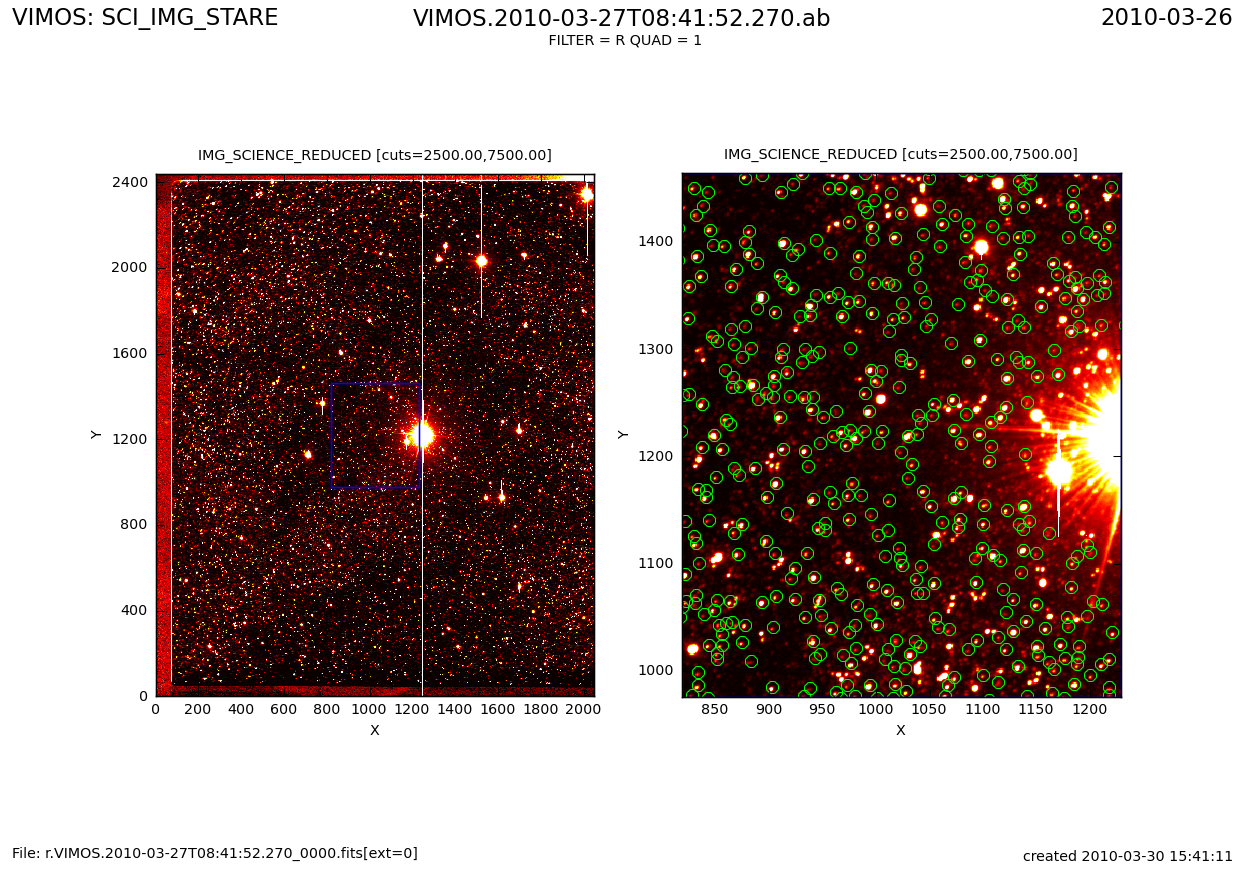
sciimg1.png upper panels: cuts through raw and reduced frames (whole frames) middel panels: cuts through raw and reduced frames (central area) lower row, 1st plot: histogram of raw frame lower row, 2nd plot: histogram of raw and reduced frames near maximum lower row, 3rd plot: histogram of image quality, red line indicates pipeline-calculated value lower row, 4th plot: histogram of ellipticity, red line indicates histogram maximum sciimg2.png left: reduced frame, found objects are marked (only if number is less than 1000) right: detailed view of image centre, found objects are marked | |||||||||||||||||||||||||||
| QC1PARAM |
QC1 parameters written in QC1 database: QC1 DB names: image_quality | image_quality_error | expected_image_quality | num_stars | mean_star_stellarity | rms_star_stellarity | mean_ellipticity | rms_ellipticity | mode_ellipticity | mean_orientation | rms_orientation | mean_stellarity | rms_stellarity | magnitude_limit | magnitude_limit_error | sky_background | sky_back_error | magnitude_zero computed by script: expected_image_quality, mode_ellipticity; all other parameters are calculated by pipeline recipe | |||||||||||||||||||||||||||
| ALGORITHM |
Description of algorithms: image_quality: robust estimate of FWHM of all stars in IMG_GALAXY_TABLE; median value and outlier rejection based on standard deviation, iterated up to 4 times image_quality_error: standard deviation of all values contributing to the final image_quality value expected_image_quality: DIMM seeing corrected for airmass, wavelength, and telescope diameter num_stars: number of stars in IMG_GALAXY_TABLE mean_star_stellarity: mean stellarity index of all stars in IMG_GALAXY_TABLE rms_star_stellarity: standard deviation of all values contributing to mean_star_stellarity mean_ellipticity: mean values of ellipticity of all stars in IMG_GALAXY_TABLE rms_ellipticity: standard deviation of all values contributing to mean_ellipticity mode_ellipticity: maximum of ellipticity distribution, determined from histogram with 0.025 binsize mean_orientation: mean orientation of star ellipses, ranging from -90 to +90 degrees, counted counter-clockwise with 0 corresponding to x axis rms_orientation: standard deviation of all values contributing to mean_orientation mean_stellarity: mean stellarity index of all objects in IMG_GALAXY_TABLE rms_stellarity: standard deviation of all stellarity values magnitude_limit: limiting magnitude; histogram of all magnitudes from stars in IMG_GALAXY_TABLE is constructed, with bin size increasing from 0.1 to 1.0 until the most populated bin contains at least 20 stars; the position of this bin is taken as the limiting magnitude magnitude_limit_error: bin size of histogram used for magnitude_limit sky_background: the central 1600x1800 pixels are divided into 10x10 regions with 160x180 pixels; the median is calculated in each region; the background estimate is the mean of the 10 lowest values, divided by exposure time sky_back_error: standard deviation of the 10 values used for sky_background magnitude_zero: zeropint as calculated from standard star field | |||||||||||||||||||||||||||
| CERTIF |
Reasons for note in GEN_INFO/NOTES.txt: stars appear strongly elliptical and the FWHM of the major axis is larger than the seeing constraint by the PI (the ellipticity histogram should have its maximum well below 0.2 for a good observation, but this is often impossible to achieve when seeing is very good, i.e. around 0.5 arcsec); flat-fielding not proper; unusual features present in image (but sky probe is often visible and there can also be reflections from moon or nearby bright stars) | |||||||||||||||||||||||||||
| COMMENTS | NONE | |||||||||||||||||||||||||||
| top | [2016-03-11T12:31:29] created by qcDocu v1.1.2, a tqs tool | |||||||||||||||||||||||||||