| This documentation is intended both for QC scientists and SciOps astronomers (who may want to ignore the technical information displayed in grey). | ||||||||||||||||||||||||||||
|
||||||||||||||||||||||||||||
| bottom plots | contact | ||||||||||||||||||||||||||||
| NAME | ||||||||||||||||||||||||||||
| VERSION |
1.0 -- December 2009 1.0.1 -- supporting numpy V1.3 and matplotlib V0.99 (2010-02-08) 1.0.2 -- overplots Balmer series (2011-02-28) 1.0.3 -- skip call of scoreQC (2011-05-31) 1.0.4 -- QC1 parameters num_overexp/level_overexp added (2012-01-20) 1.0.5 -- for new HR_blue grisms (2012-06-05) 1.0.6 -- bug fix with plot for all four quadrants (2012-07-09) 1.0.7 -- changes needed for muc (2013-02-07) 1.0.8 -- remove usage of has_key dictionary attribute (2014-03-12) 1.1 -- new: plot response curve (2014-06-06) | |||||||||||||||||||||||||||
| SYNTAX | PYTHON | |||||||||||||||||||||||||||
| CALL |
processQC from $DFS_PRODUCT/STD_IFU/$DATE /home/vimos/python/vimos_stdifu.py -i -a $AB | |||||||||||||||||||||||||||
| INSTRUMENT | VIMOS | |||||||||||||||||||||||||||
| RAWTYPE | ||||||||||||||||||||||||||||
| PURPOSE | QC check on IFU standard star products | |||||||||||||||||||||||||||
| PROCINPUT | products: IFU_SCIENCE_SKY, IFU_STD_FOV, IFU_SPECPHOT_TABLE | |||||||||||||||||||||||||||
| QC1TABLE |
trending | table(s) in QC1 database: vimos_ifu_std | |||||||||||||||||||||||||||
| TRENDPLOT |
trending | HealthCheck plot(s) associated to this procedure: trend_report_IFUEFF_LRb_HC.html | trend_report_IFUEFF_LRr_HC.html | trend_report_IFUEFF_MR_HC.html | trend_report_IFUEFF_HRb_HC.html | trend_report_IFUEFF_HRo_HC.html | trend_report_IFUEFF_HRr_HC.html | |||||||||||||||||||||||||||
| QC1PAGE |
trending | associated documentation: ifu_stdeff_qc1.html | |||||||||||||||||||||||||||
| QC1PLOTS top |
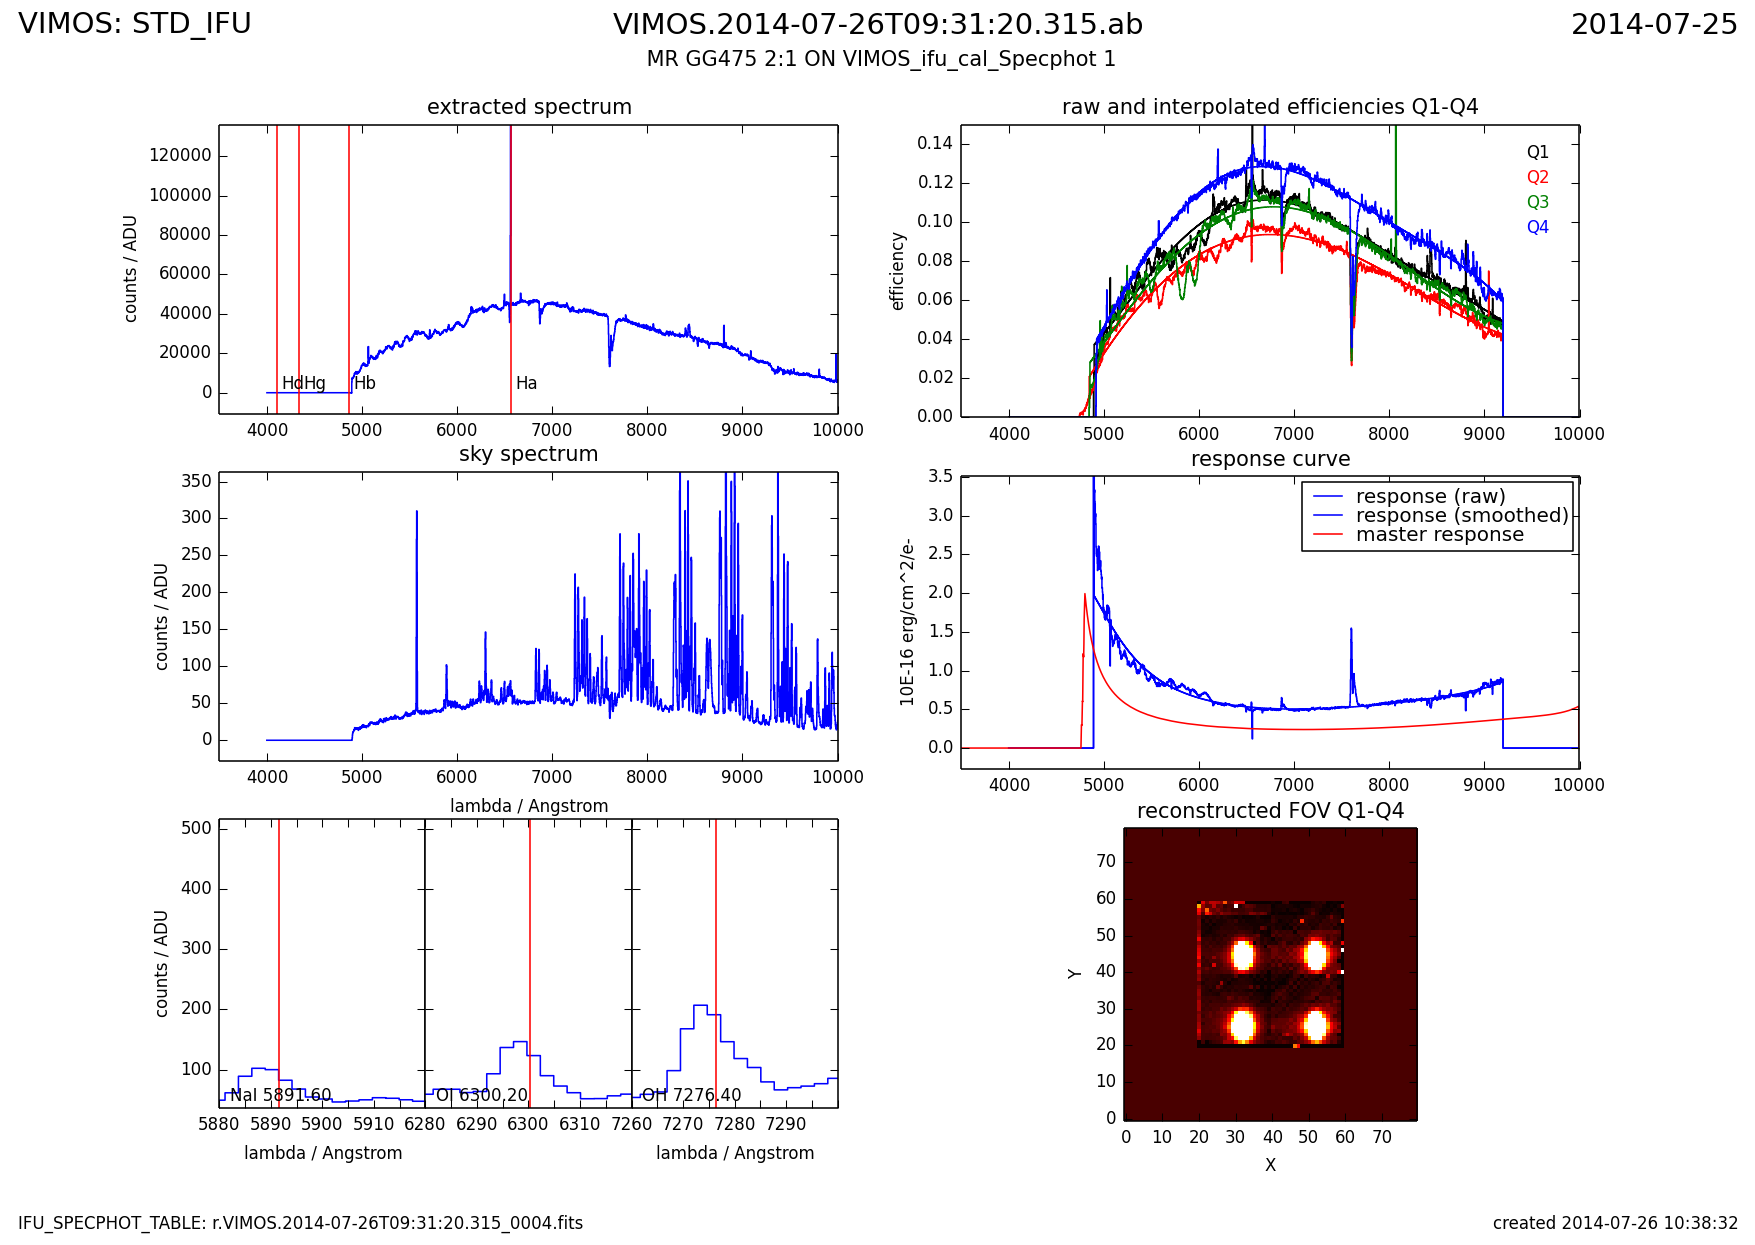
stdifu0.png upper left panel: extracted and summed up object spectrum middle left panel: sky spectrum lower left panel: details of sky spectrum with comparison to nominal wavelengths of sky lines upper right panel: efficiency vs. wavelength for all 4 quadrants; they are plotted per wavelength bin and as a smoothed and interpolated version middel right panel: current response curve compared to master response lower right panel: reconstructed field of view; combined image for all 4 quadrants | |||||||||||||||||||||||||||
| QC1PARAM | QC1 parameters written in QC1 database: efficiency1 | efficiency2 | ... | efficiency15 | |||||||||||||||||||||||||||
| ALGORITHM |
Description of algorithms: efficiencyNN: ratio of the detected number of photons to the real number of photons at dedicated wavelength ranges | |||||||||||||||||||||||||||
| CERTIF |
Reasons for rejection: observation without attached (mandatory) calibrations, badly reconstructed IFU image, low flux because of instrumental problems or unstable weather conditions | |||||||||||||||||||||||||||
| COMMENTS | NONE | |||||||||||||||||||||||||||
| top | [2016-03-11T12:31:27] created by qcDocu v1.1.2, a tqs tool | |||||||||||||||||||||||||||