|
|
 |
|
|
| ERIS trending system: HEALTH CHECK report |
|
|
| Last update: 2026-08-03T03:00:18 (UT)
|
|
|
|
|
| General news: |
NOTE: The Health Check and calChecker services have been moved to qcFlow. These pages are only maintained for comparison
and will be removed in 2026.
|
|
ERIS news:
|
|
Report news:

|
|
|
|
|
|
|

|
|
|
Plot
? |
Symb
? |
Source
* |
Average ? |
Thresholds ? |
N_
data |
QC1
parameter |
Data
downloads |
Remarks |
| method |
value |
unit |
method |
value |
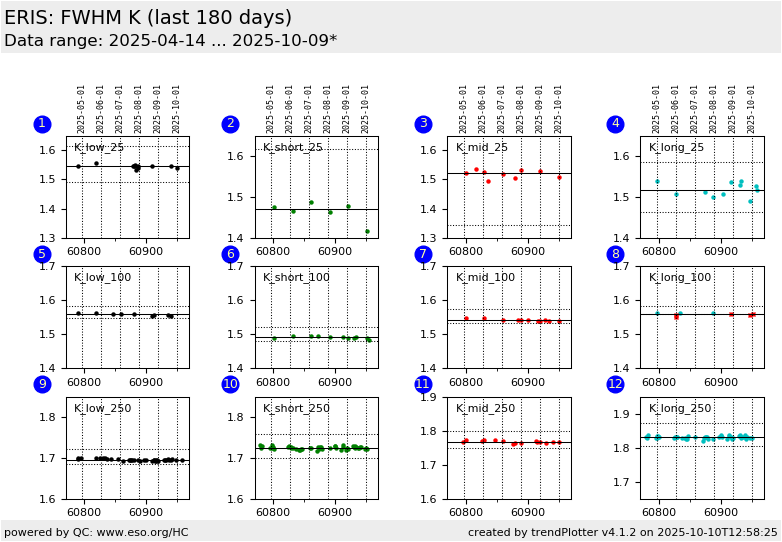
| 1 |
• | QC1DB |
MEDIAN |
1.54 |
NONE |
VAL | 1.49,1.614 |
18 |
qc_wave_fwhm_med |
this |
last_yr |
all
|
FWHM: K_low/25 mas scale |
| 2 |
• | QC1DB |
MEDIAN |
1.48 |
NONE |
VAL | 1.331,1.618 |
6 |
qc_wave_fwhm_med |
this |
last_yr |
all
|
FWHM: K_short/25 mas scale |
| 3 |
• | QC1DB |
MEDIAN |
1.51 |
NONE |
VAL | 1.343,1.7 |
9 |
qc_wave_fwhm_med |
this |
last_yr |
all
|
FWHM: K_middle/25 mas scale |
| 4 |
• | QC1DB |
MEDIAN |
1.51 |
NONE |
VAL | 1.463,1.585 |
13 |
qc_wave_fwhm_med |
this |
last_yr |
all
|
FWHM: K_long/25 mas scale |
|
| 5 |
• | QC1DB |
MEDIAN |
1.56 |
NONE |
VAL | 1.5486,1.5816 |
10 |
qc_wave_fwhm_med |
this |
last_yr |
all
|
FWHM: K_low/100 mas scale |
| 6 |
• | QC1DB |
MEDIAN |
1.49 |
NONE |
VAL | 1.4808,1.5197 |
6 |
qc_wave_fwhm_med |
this |
last_yr |
all
|
FWHM: K_short/100 mas scale |
| 7 |
• | QC1DB |
MEDIAN |
1.53 |
NONE |
VAL | 1.5316,1.5745 |
12 |
qc_wave_fwhm_med |
this |
last_yr |
all
|
FWHM: K_middle/100 mas scale |
| 8 |
• | QC1DB |
MEDIAN |
1.55 |
NONE |
VAL | 1.5596,1.5836 |
6 |
qc_wave_fwhm_med |
this |
last_yr |
all
|
FWHM: K_long/100 mas scale |
|
| 9 |
• | QC1DB |
MEDIAN |
1.69 |
NONE |
VAL | 1.6836,1.7208 |
19 |
qc_wave_fwhm_med |
this |
last_yr |
all
|
FWHM: K_low/250 mas scale |
| 10 |
• | QC1DB |
MEDIAN |
1.72 |
NONE |
VAL | 1.6985,1.759 |
22 |
qc_wave_fwhm_med |
this |
last_yr |
all
|
FWHM: K_short/250 mas scale |
| 11 |
• | QC1DB |
MEDIAN |
1.76 |
NONE |
VAL | 1.7483,1.7994 |
9 |
qc_wave_fwhm_med |
this |
last_yr |
all
|
FWHM: K_middle/250 mas scale |
| 12 |
• | QC1DB |
MEDIAN |
1.82 |
NONE |
VAL | 1.8055,1.8721 |
24 |
qc_wave_fwhm_med |
this |
last_yr |
all
|
FWHM: K_long/250 mas scale |
|
| |
|
*Data sources: QC1DB: QC1 database; LOCAL: local data source
|
Plot 1
scores:  3| 3|
| | data source: | eris_ifu_wave
(QC1 database) |
| dataset: | qc_wave_fwhm_med | • |
| median: | 1.54 | NONE |
| fixed thresholds: | 1.49...1.614 | NONE |
| N_data plotted: | 18 |
| [click plot for closeup] |
Plot 2
scores: 2|
| | data source: | eris_ifu_wave
(QC1 database) |
| dataset: | qc_wave_fwhm_med | • |
| median: | 1.48 | NONE |
| fixed thresholds: | 1.331...1.618 | NONE |
| N_data plotted: | 6 |
| [click plot for closeup] |
Plot 3
scores: 1|
| | data source: | eris_ifu_wave
(QC1 database) |
| dataset: | qc_wave_fwhm_med | • |
| median: | 1.51 | NONE |
| fixed thresholds: | 1.343...1.7 | NONE |
| N_data plotted: | 9 |
| [click plot for closeup] |
Plot 4
scores: 2|
| | data source: | eris_ifu_wave
(QC1 database) |
| dataset: | qc_wave_fwhm_med | • |
| median: | 1.51 | NONE |
| fixed thresholds: | 1.463...1.585 | NONE |
| N_data plotted: | 13 |
| [click plot for closeup] |
Plot 5
scores: 1|
| | data source: | eris_ifu_wave
(QC1 database) |
| dataset: | qc_wave_fwhm_med | • |
| median: | 1.56 | NONE |
| fixed thresholds: | 1.5486...1.5816 | NONE |
| N_data plotted: | 10 |
| [click plot for closeup] |
Plot 6
scores: 2|
| | data source: | eris_ifu_wave
(QC1 database) |
| dataset: | qc_wave_fwhm_med | • |
| median: | 1.49 | NONE |
| fixed thresholds: | 1.4808...1.5197 | NONE |
| N_data plotted: | 6 |
| [click plot for closeup] |
Plot 7
scores: 1|
| | data source: | eris_ifu_wave
(QC1 database) |
| dataset: | qc_wave_fwhm_med | • |
| median: | 1.53 | NONE |
| fixed thresholds: | 1.5316...1.5745 | NONE |
| N_data plotted: | 12 |
| [click plot for closeup] |
Plot 8
scores:  1| 1|
| | data source: | eris_ifu_wave
(QC1 database) |
| dataset: | qc_wave_fwhm_med | • |
| median: | 1.55 | NONE |
| fixed thresholds: | 1.5596...1.5836 | NONE |
| N_data plotted: | 6 |
| [click plot for closeup] |
Plot 9
scores: 6|
| | data source: | eris_ifu_wave
(QC1 database) |
| dataset: | qc_wave_fwhm_med | • |
| median: | 1.69 | NONE |
| fixed thresholds: | 1.6836...1.7208 | NONE |
| N_data plotted: | 19 |
| [click plot for closeup] |
Plot 10
scores: 3|
| | data source: | eris_ifu_wave
(QC1 database) |
| dataset: | qc_wave_fwhm_med | • |
| median: | 1.72 | NONE |
| fixed thresholds: | 1.6985...1.759 | NONE |
| N_data plotted: | 22 |
| [click plot for closeup] |
Plot 11
scores: 1|
| | data source: | eris_ifu_wave
(QC1 database) |
| dataset: | qc_wave_fwhm_med | • |
| median: | 1.76 | NONE |
| fixed thresholds: | 1.7483...1.7994 | NONE |
| N_data plotted: | 9 |
| [click plot for closeup] |
Plot 12
scores: 3|
| | data source: | eris_ifu_wave
(QC1 database) |
| dataset: | qc_wave_fwhm_med | • |
| median: | 1.82 | NONE |
| fixed thresholds: | 1.8055...1.8721 | NONE |
| N_data plotted: | 24 |
| [click plot for closeup] |
Click on any of the plots to see a close-up version.
The latest date is indicated on top of the plot.
If configured,
- data points belonging to the latest date are specially marked
- statistical averages are indicated by a solid line, and thresholds by broken lines
- outliers are marked by a red asterisk. They are defined as data points outside the
threshold lines
- "aliens" (= data points outside the plot Y limits) are marked by a red arrow (↑ or ↓)
- you can download the data for each parameter set if the 'Data downloads' link shows up
|
|
|