|
|
 |
|
|
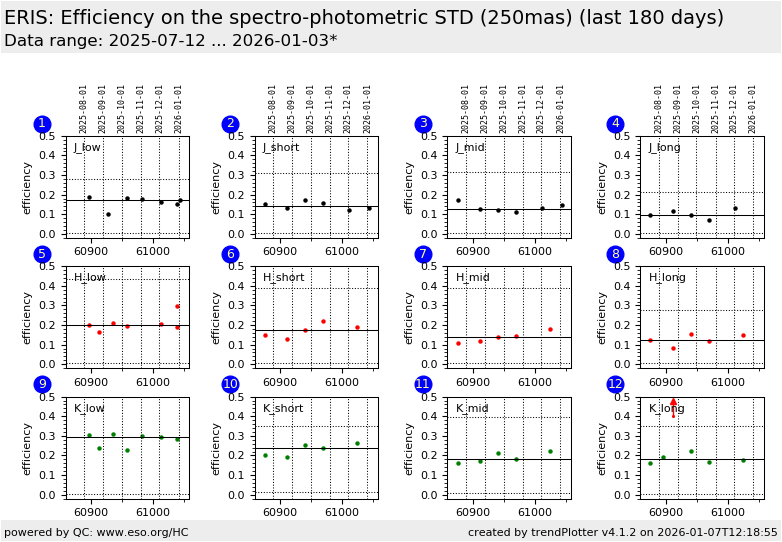
| ERIS trending system: HEALTH CHECK report |
|
|
| Last update: 2026-04-30T12:19:41 (UT)
|
|
|
|
|
| General news: |
NOTE: The Health Check and calChecker services have been moved to qcFlow. These pages are only maintained for comparison
and will be removed in 2026.
|
|
ERIS news:
|
|
Report news:

|
|
|
|
|
|
|

|
|
|
Plot
? |
Symb
? |
Source
* |
Average ? |
Thresholds ? |
N_
data |
QC1
parameter |
Data
downloads |
Remarks |
| method |
value |
unit |
method |
value |
| 1 |
• | QC1DB |
MEDIAN |
0.165 |
NONE |
VAL | 0.005,0.279 |
6 |
qc_eff_median |
this |
last_yr |
all
|
efficiency J-band_low (averaged on bins) 250mas |
| 2 |
• | QC1DB |
MEDIAN |
0.135 |
NONE |
VAL | 0.005,0.312 |
5 |
qc_eff_median |
this |
last_yr |
all
|
efficiency J-band_short |
| 3 |
• | QC1DB |
MEDIAN |
0.134 |
NONE |
VAL | 0.005,0.314 |
5 |
qc_eff_median |
this |
last_yr |
all
|
efficiency J-band_middle |
| 4 |
• | QC1DB |
MEDIAN |
0.135 |
NONE |
VAL | 0.005,0.211 |
2 |
qc_eff_median |
this |
last_yr |
all
|
efficiency J-band_long |
|
| 5 |
• | QC1DB |
MEDIAN |
0.206 |
NONE |
VAL | 0.005,0.437 |
6 |
qc_eff_median |
this |
last_yr |
all
|
efficiency H-band_low (averaged on bins) 250mas |
| 6 |
• | QC1DB |
MEDIAN |
0.2 |
NONE |
VAL | 0.005,0.387 |
4 |
qc_eff_median |
this |
last_yr |
all
|
efficiency H-band_short |
| 7 |
• | QC1DB |
MEDIAN |
0.158 |
NONE |
VAL | 0.005,0.389 |
4 |
qc_eff_median |
this |
last_yr |
all
|
efficiency H-band_middle |
| 8 |
• | QC1DB |
MEDIAN |
0.146 |
NONE |
VAL | 0.005,0.277 |
4 |
qc_eff_median |
this |
last_yr |
all
|
efficiency H-band_long |
|
| 9 |
• | QC1DB |
MEDIAN |
0.285 |
NONE |
VAL | 0.005,0.533 |
6 |
qc_eff_median |
this |
last_yr |
all
|
efficiency K-band_low (averaged on bins) 250mas |
| 10 |
• | QC1DB |
MEDIAN |
0.223 |
NONE |
VAL | 0.015,0.35 |
4 |
qc_eff_median |
this |
last_yr |
all
|
efficiency J-band_short |
| 11 |
• | QC1DB |
MEDIAN |
0.223 |
NONE |
VAL | 0.007,0.395 |
4 |
qc_eff_median |
this |
last_yr |
all
|
efficiency K-band_middle |
| 12 |
• | QC1DB |
MEDIAN |
0.179 |
NONE |
VAL | 0.005,0.351 |
4 |
qc_eff_median |
this |
last_yr |
all
|
efficiency K-band_long |
|
| |
|
*Data sources: QC1DB: QC1 database; LOCAL: local data source
|
Plot 1
scores:  1| 1|
| | data source: | eris_ifu_efficiency
(QC1 database) |
| dataset: | qc_eff_median | • |
| median: | 0.165 | NONE |
| fixed thresholds: | 0.005...0.279 | NONE |
| N_data plotted: | 6 |
| [click plot for closeup] |
Plot 2
scores: 1|
| | data source: | eris_ifu_efficiency
(QC1 database) |
| dataset: | qc_eff_median | • |
| median: | 0.135 | NONE |
| fixed thresholds: | 0.005...0.312 | NONE |
| N_data plotted: | 5 |
| [click plot for closeup] |
Plot 3
scores: 1|
| | data source: | eris_ifu_efficiency
(QC1 database) |
| dataset: | qc_eff_median | • |
| median: | 0.134 | NONE |
| fixed thresholds: | 0.005...0.314 | NONE |
| N_data plotted: | 5 |
| [click plot for closeup] |
Plot 4
scores: 1|
| | data source: | eris_ifu_efficiency
(QC1 database) |
| dataset: | qc_eff_median | • |
| median: | 0.135 | NONE |
| fixed thresholds: | 0.005...0.211 | NONE |
| N_data plotted: | 2 |
| [click plot for closeup] |
Plot 5
scores: 1|
| | data source: | eris_ifu_efficiency
(QC1 database) |
| dataset: | qc_eff_median | • |
| median: | 0.206 | NONE |
| fixed thresholds: | 0.005...0.437 | NONE |
| N_data plotted: | 6 |
| [click plot for closeup] |
Plot 6
scores: 1|
| | data source: | eris_ifu_efficiency
(QC1 database) |
| dataset: | qc_eff_median | • |
| median: | 0.2 | NONE |
| fixed thresholds: | 0.005...0.387 | NONE |
| N_data plotted: | 4 |
| [click plot for closeup] |
Plot 7
scores: 1|
| | data source: | eris_ifu_efficiency
(QC1 database) |
| dataset: | qc_eff_median | • |
| median: | 0.158 | NONE |
| fixed thresholds: | 0.005...0.389 | NONE |
| N_data plotted: | 4 |
| [click plot for closeup] |
Plot 8
scores: 1|
| | data source: | eris_ifu_efficiency
(QC1 database) |
| dataset: | qc_eff_median | • |
| median: | 0.146 | NONE |
| fixed thresholds: | 0.005...0.277 | NONE |
| N_data plotted: | 4 |
| [click plot for closeup] |
Plot 9
scores: 1|
| | data source: | eris_ifu_efficiency
(QC1 database) |
| dataset: | qc_eff_median | • |
| median: | 0.285 | NONE |
| fixed thresholds: | 0.005...0.533 | NONE |
| N_data plotted: | 6 |
| [click plot for closeup] |
Plot 10
scores: 1|
| | data source: | eris_ifu_efficiency
(QC1 database) |
| dataset: | qc_eff_median | • |
| median: | 0.223 | NONE |
| fixed thresholds: | 0.015...0.35 | NONE |
| N_data plotted: | 4 |
| [click plot for closeup] |
Plot 11
scores: 1|
| | data source: | eris_ifu_efficiency
(QC1 database) |
| dataset: | qc_eff_median | • |
| median: | 0.223 | NONE |
| fixed thresholds: | 0.007...0.395 | NONE |
| N_data plotted: | 4 |
| [click plot for closeup] |
Plot 12
scores: 1|
| | data source: | eris_ifu_efficiency
(QC1 database) |
| dataset: | qc_eff_median | • |
| median: | 0.179 | NONE |
| fixed thresholds: | 0.005...0.351 | NONE |
| N_data plotted: | 4 |
| [click plot for closeup] |
The EFFICIENCY data are taken every month under clear or photometric conditions with 250mas.
The efficiency is calculated over several bins.
General information
Click on any of the plots to see a close-up version.
The latest date is indicated on top of the plot.
If configured,
- data points belonging to the latest date are specially marked
- statistical averages are indicated by a solid line, and thresholds by broken lines
- outliers are marked by a red asterisk. They are defined as data points outside the
threshold lines
- "aliens" (= data points outside the plot Y limits) are marked by a red arrow (↑ or ↓)
- you can download the data for each parameter set if the 'Data downloads' link shows up
|
|
|