Plot
? |
Symb
? |
Source
* |
OPS?
** |
Average ? |
Thresholds ? |
N_
data |
QC1
parameter |
Data
downloads |
Remarks |
| method |
value |
unit |
method |
value |
| 1 |
■ | QC1DB |
no |
none |
|
NONE |
none | |
174 |
median_master |
this |
last_yr |
all
|
red sensitive MIT upper chip |
| 1 |
■ | QC1DB |
no |
none |
|
NONE |
none | |
174 |
median_master |
this |
last_yr |
all
|
red sensitive MIT lower chip |
| 1 |
■ | QC1DB |
no |
none |
|
NONE |
none | |
0 |
median_master |
this |
last_yr |
all
|
blue sensitive EEV upper chip |
| 1 |
■ | QC1DB |
no |
none |
|
NONE |
none | |
0 |
median_master |
this |
last_yr |
all
|
blue sensitive EEV lower chip |
| |
|
*Data sources: QC1DB: QC1 database; LOCAL: local text file | **OPS: OPSLOG data are included
|
Plot 1
scores: not implemented
| | data source: | fors2_bias
(QC1 database) |
dataset:
(numbers below apply to this dataset) | median_master | ■ |
| average: | none |
| thresholds: | none |
| N_data plotted: | 174 |
| [click on plot for closeup] |
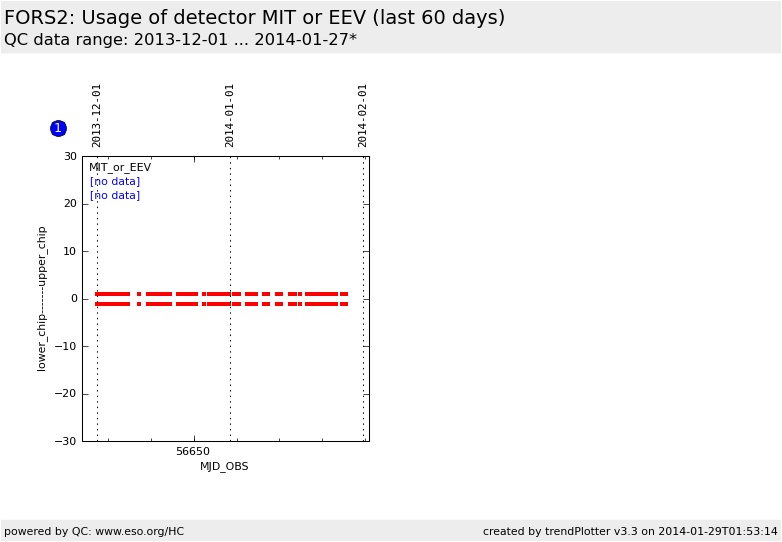
This plot shows which of both detectors is in use.
- Red points for the red-sensitive MIT detector, used as the default one
- Blue points for ther blue-sensitive EEV detector, mostly used for visitors
Each detector is a mosaic composed of two chips, the upper and the lower chip.
The data are retrieved from pipeline processed bias frames for both
chips of the mosaic detector separately to monitor potential failures
of one of the two chips.
General information
Click on any of the plots to see a close-up version.
The latest date is indicated on top of the plot, data points belonging to that date are specially marked.
If configured,
- statistical averages are indicated by a solid line, and thresholds by broken lines
- outliers are marked by a red asterisk. They are defined as data points outside the
threshold lines
- "aliens" (= data points outside the plot Y limits) are marked by a red arrow (↑ or ↓)
- you can download the data for each parameter set if the 'Data downloads' link shows up
|

