Plot
? |
Symb
? |
Source
* |
Average ? |
Thresholds ? |
N_
data |
QC1
parameter |
Data
downloads |
Remarks |
| method |
value |
unit |
method |
value |
| 1 |
♦ | QC1DB |
none |
|
mag |
none | |
0 |
extinction |
this |
last_yr |
all
|
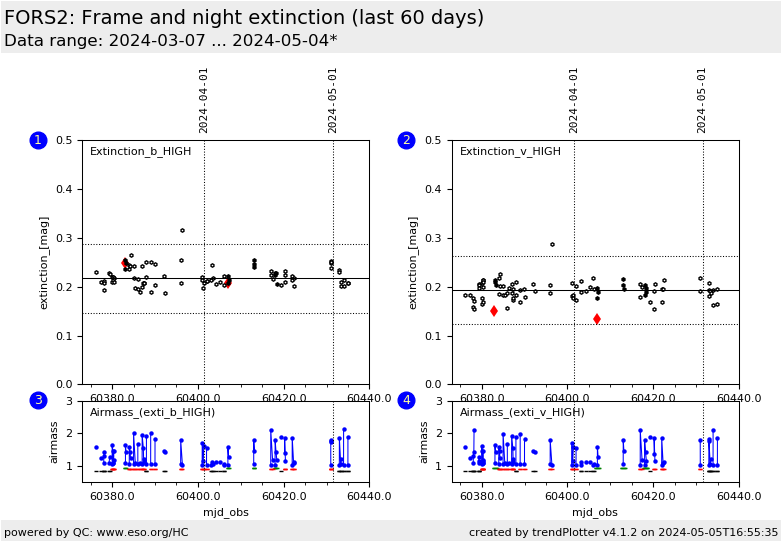
Night extinction values for b_HIGH and detector CCID20-14-5-3 (HC plot: 28 days delay; available since 2012-06). The extinction is only displayed for nights with stable photometric conditions (stable flag is 'S' or 'Sb'). |
| 1 |
o | QC1DB |
MEDIAN |
0.204 |
mag |
OFF | ± 0.07 |
8 |
ext_coeff |
this |
last_yr |
all
|
Frame extinction values from STD_IMA data for above filter and chip. Values for num_stars <3 suppressed. These values are derived from single frames, under the assumption of a constant zeropoint. All values are plotted, regardless of 'stable' flag value. |
| 1 |
• | QC1DB |
none |
|
mag |
none | |
0 |
ext_coeff |
this |
last_yr |
all
|
same, only values for nights with flag 'S' or 'Sb' are plotted |
| 2 |
♦ | QC1DB |
none |
|
mag |
none | |
0 |
extinction |
this |
last_yr |
all
|
same as plot1 (night extinction values), for filter v_HIGH |
| 2 |
o | QC1DB |
MEDIAN |
0.0862 |
mag |
OFF | ± 0.07 |
8 |
ext_coeff |
this |
last_yr |
all
|
same as plot1 (frame extinction values), for filter v_HIGH |
| 2 |
• | QC1DB |
none |
|
mag |
none | |
0 |
ext_coeff |
this |
last_yr |
all
|
same, only values for nights with flag 'S' or 'Sb' are plotted |
|
| 3 |
• | QC1DB |
none |
|
NONE |
none | |
8 |
airmass |
this |
last_yr |
all
|
Airmass for values in plot 1 (b_HIGH). For nights classified 'S' or 'Sb' there should always be a pair with delta_AIRM > 0.4. Data points per night are connected by a line. |
| 3 |
– | QC1DB |
none |
|
NONE |
none | |
0 |
mjd_obs |
|
green bar: night has been classified 'S' (photometrically stable) or 'Sb' (photometric at begin but no more data later); red bar: 'N' (not stable); black bar: 'U' (unknown, no low-high-airmass pair taken); all data apply to the filter above |
| 4 |
• | QC1DB |
none |
|
NONE |
none | |
8 |
airmass |
this |
last_yr |
all
|
same, for filter v_HIGH |
| |
|
*Data sources: QC1DB: QC1 database; LOCAL: local data source
|
Plot 1
scores: not implemented
| | data source: | fors2_photometry
(QC1 database) |
dataset:
(numbers below apply to this dataset) | extinction | ♦ |
| average: | none |
| thresholds: | none |
| N_data plotted: | 0 |
| [click plot for closeup] |
Plot 2
scores: not implemented
| | data source: | fors2_photometry
(QC1 database) |
dataset:
(numbers below apply to this dataset) | extinction | ♦ |
| average: | none |
| thresholds: | none |
| N_data plotted: | 0 |
| [click plot for closeup] |
Plot 3
scores: not implemented
| | data source: | fors2_zp_frame
(QC1 database) |
dataset:
(numbers below apply to this dataset) | airmass | • |
| average: | none |
| thresholds: | none |
| N_data plotted: | 8 |
| [click plot for closeup] |
Plot 4
scores: not implemented
| | data source: | fors2_zp_frame
(QC1 database) |
dataset:
(numbers below apply to this dataset) | airmass | • |
| average: | none |
| thresholds: | none |
| N_data plotted: | 8 |
| [click plot for closeup] |
This plot displays the extinction calculated by the pipeline recipe
fors_zeropoint for each individual STD_IMA frame, and the nightly extinction
as calculated by fors_photometry. The frame extinction is calculated with a
constant instrument zeropoint which is a reasonable assumption. The true
zeropoint may however deviate from the assumed one which comes from a static
table. The frame extinction values are plotted for all nights (with 'stable'
flag values 'S', 'Sb', 'N' and 'U'; open circles), as well as for stable nights ('S'
or 'Sb', filled circles). For a definition of this flag see the 'IMG
zeropoint' plots.
The nightly zeropoints are plotted here
only for stable nights ('S' or 'Sb').
We plot here only values for chip 1. For the other chip, you may want to
use the link to the QC1 database.
The nightly extinctions
are based on the FORS2
calibration plan as part of the FORS2 Absolute Photometry (FAP) project. It
foresees the acquisition of an initial pair of standard stars for "promising" nights, and the
follow-up standard star fields for actually photometric nights with
SCIENCE observations requiring photometric conditions.
In the lower panel, the airmasses of the individual
standard star fields taken in the course of the night are plotted.
One can clearly see the initial low-high-airmass pair if acquired. We also
mark 'S'/'Sb' nights by a green bar, 'N' nights in red, and 'U' nights in
black.
Due to the
selection window and the data processing schedule, the nightly extinction
values become available typically after a month.
The pipeline recipe fors_photometry is operational since 2012-06,
hence the nightly extinctions are
available from the same date on.
All HISTORY plots earlier than 2012-06 do not have
night extinctions.
More information can be found on
the plot
tutorial page.
General information
Click on any of the plots to see a close-up version.
The latest date is indicated on top of the plot.
If configured,
- data points belonging to the latest date are specially marked
- statistical averages are indicated by a solid line, and thresholds by broken lines
- outliers are marked by a red asterisk. They are defined as data points outside the
threshold lines
- "aliens" (= data points outside the plot Y limits) are marked by a red arrow (↑ or ↓)
- you can download the data for each parameter set if the 'Data downloads' link shows up
|
