|
|
Health Check monitor |
|
C
[page auto-refreshes after 300 sec]
[press Ctrl+R to enforce refresh of scores and dates]
|
||||||||||||||||||||||||||||||||||||||||||||||||||||||||||||||||||||||
| FORS2 trending system: HEALTH CHECK plot | ||||||||||||||||||||||||||||||||||||||||||||||||||||||||||||||||||||||
|
||||||||||||||||||||||||||||||||||||||||||||||||||||||||||||||||||||||
|
||||||||||||||||||||||||||||||||||||||||||||||||||||||||||||||||||||||
|
||||||||||||||||||||||||||||||||||||||||||||||||||||||||||||||||||||||

|
||||||||||||||||||||||||||||||||||||||||||||||||||||||||||||||||||||||
|
||||||||||||||||||||||||||||||||||||||||||||||||||||||||||||||||||||||
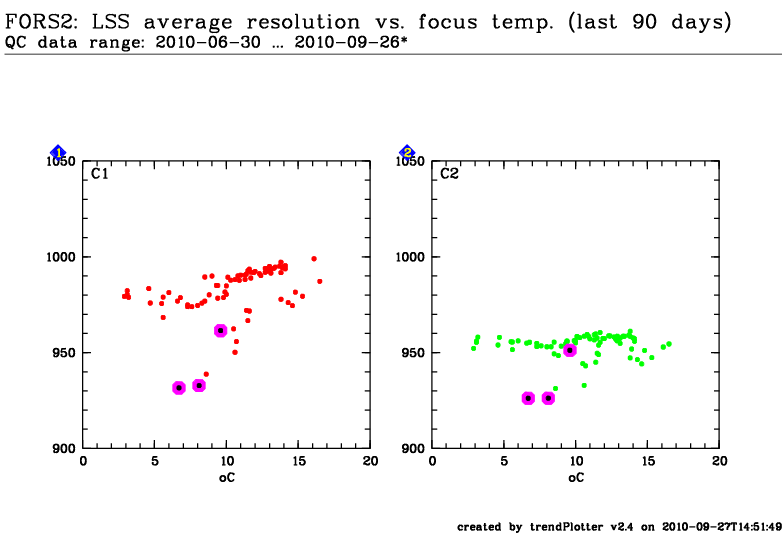
From a wavelength calibrated LSS arc lamp exposure, the mean spectral resolution from all lines in the catalog is computed. Each single spectral resolution is computed as the ratio between the arc lamp line wavelength and its FWHM. The values trended here are for the red sensitive MIT detector, the 300V grism with no filter and a slit width of 0.29". On 2018-08-28 new pipeline (v.5.3.35) was introduced. The method of calculating spectral resolution changed and the new values are significantly lower. On 2024-09-01 binning of the LSS_HC_LAMP calibrations was changed from 2x2 to 1x1. This created a jump in the resolution estimates.
DB Name: fors2_lss_wave General information Click on any of the plots to see a close-up version. If applicable, the latest values from Paranal ops logs are plotted as blue dots. More information about those values, including a download option, is available in the OPS column. The latest date is indicated on top of the plot, data points belonging to that date are specially marked.If configured,
|
||||||||||||||||||||||||||||||||||||||||||||||||||||||||||||||||||||||