Plot
? |
Symb
? |
Source
* |
Average ? |
Thresholds ? |
N_
data |
QC1
parameter |
Data
downloads |
Remarks |
| method |
value |
unit |
method |
value |
| 1 |
. | QC1DB |
none |
|
NONE |
VAL | -1,2 |
6 |
l_offset |
this |
last_yr |
all
|
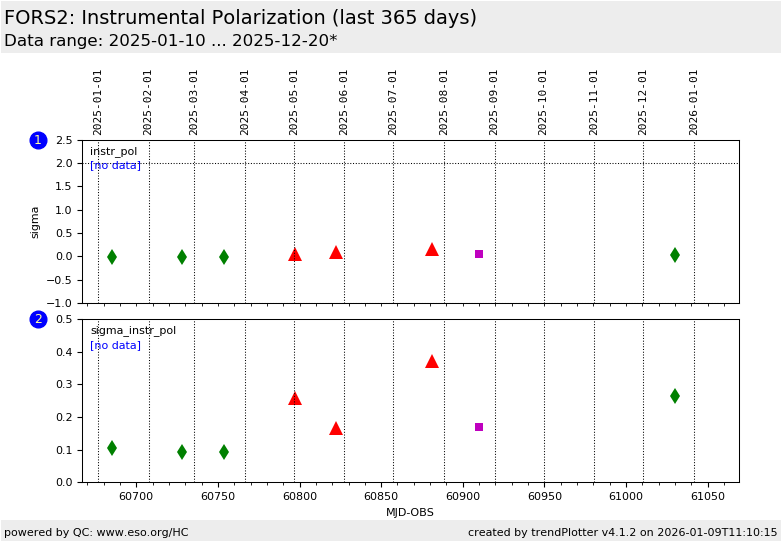
instrumental polarization (in units of sigma) for all bands |
| 1 |
• | QC1DB |
none |
|
NONE |
none | |
1 |
l_offset |
this |
last_yr |
all
|
instrumental polarization (in units of sigma) for the B band |
| 1 |
♦ | QC1DB |
none |
|
NONE |
none | |
3 |
l_offset |
this |
last_yr |
all
|
instrumental polarization (in units of sigma) for the V band |
| 1 |
▲ | QC1DB |
none |
|
NONE |
none | |
1 |
l_offset |
this |
last_yr |
all
|
instrumental polarization (in units of sigma) for the R band |
| 1 |
■ | QC1DB |
none |
|
NONE |
none | |
1 |
l_offset |
this |
last_yr |
all
|
instrumental polarization (in units of sigma) for the I band |
| 2 |
. | QC1DB |
none |
|
NONE |
none | |
6 |
err_l_offset |
this |
last_yr |
all
|
sigma of the instrumental polarization for all bands |
| 2 |
• | QC1DB |
none |
|
NONE |
none | |
1 |
err_l_offset |
this |
last_yr |
all
|
sigma of the instrumental polarization for the B band |
| 2 |
♦ | QC1DB |
none |
|
NONE |
none | |
3 |
err_l_offset |
this |
last_yr |
all
|
sigma of the instrumental polarization for the V band |
| 2 |
▲ | QC1DB |
none |
|
NONE |
none | |
1 |
err_l_offset |
this |
last_yr |
all
|
sigma of the instrumental polarization for the R band |
| 2 |
■ | QC1DB |
none |
|
NONE |
none | |
1 |
err_l_offset |
this |
last_yr |
all
|
sigma of the instrumental polarization for the I band |
| |
|
*Data sources: QC1DB: QC1 database; LOCAL: local data source
|
Plot 1
scores:  1| 1|
| | data source: | fors2_std_pmos
(QC1 database) |
dataset:
(numbers below apply to this dataset) | l_offset | . |
| average: | none |
| fixed thresholds: | -1...2 | NONE |
| N_data plotted: | 6 |
| [click plot for closeup] |
Plot 2
scores: not implemented
| | data source: | fors2_std_pmos
(QC1 database) |
dataset:
(numbers below apply to this dataset) | err_l_offset | . |
| average: | none |
| thresholds: | none |
| N_data plotted: | 6 |
| [click plot for closeup] |
For unpolarized standard stars the pipeline determines the measured
value.
Since polarization parameters are usually tabulated for
broad-band filters the pipeline selects the broad-band filter closest to
the central wavelength of the grism.
Values significantly different from zero might indicate
instrumental polarization. Since the error of the polarization plays
an important role here we plot it in the lower panel.
Only data with an error below 0.5 in instrumental polarization are trended.
The corresponding instruments polarization normalized with its error used
to be monitored. However, since 2024-04 we have been monitoring the actual
value of the polarization.
General information
Click on any of the plots to see a close-up version.
The latest date is indicated on top of the plot.
If configured,
- data points belonging to the latest date are specially marked
- statistical averages are indicated by a solid line, and thresholds by broken lines
- outliers are marked by a red asterisk. They are defined as data points outside the
threshold lines
- "aliens" (= data points outside the plot Y limits) are marked by a red arrow (↑ or ↓)
- you can download the data for each parameter set if the 'Data downloads' link shows up
|
