Plot
? |
Symb
? |
Source
* |
OPS?
** |
Average ? |
Thresholds ? |
N_
data |
QC1
parameter |
Data
downloads |
Remarks |
| method |
value |
unit |
method |
value |
| 1 |
• | QC1DB |
no |
none |
|
NONE |
none | |
14 |
efficiency_1 |
this |
last_yr |
all
|
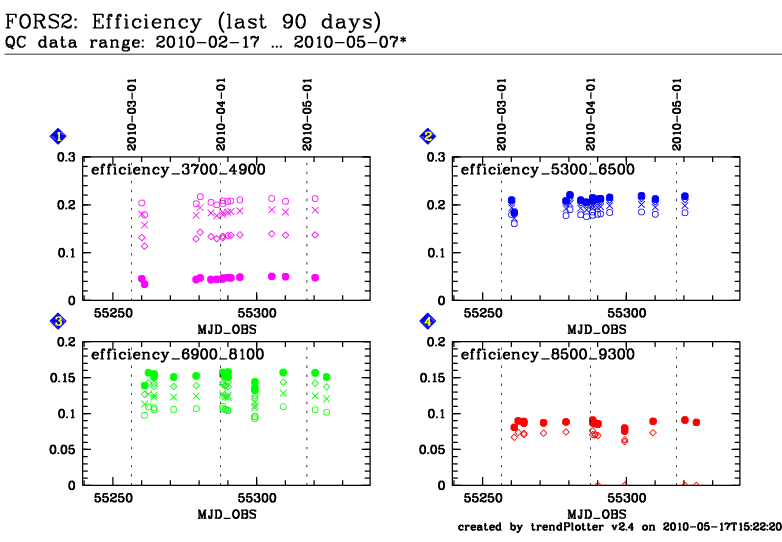
efficiency_1 (3700A, 300V, no filter) |
| 1 |
◊ | QC1DB |
no |
none |
|
NONE |
none | |
14 |
efficiency_2 |
this |
last_yr |
all
|
efficiency_2 (4100A, 300V, no filter) |
| 1 |
x | QC1DB |
no |
none |
|
NONE |
none | |
14 |
efficiency_3 |
this |
last_yr |
all
|
efficiency_3 (4500A, 300V, no filter) |
| 1 |
o | QC1DB |
no |
none |
|
NONE |
none | |
14 |
efficiency_4 |
this |
last_yr |
all
|
efficiency_4 (4900A, 300V, no filter) |
| 2 |
• | QC1DB |
no |
none |
|
NONE |
none | |
14 |
efficiency_5 |
this |
last_yr |
all
|
efficiency_5 (5300A, 300V, no filter) |
| 2 |
◊ | QC1DB |
no |
none |
|
NONE |
none | |
14 |
efficiency_6 |
this |
last_yr |
all
|
efficiency_6 (5700A, 300V, no filter) |
| 2 |
x | QC1DB |
no |
none |
|
NONE |
none | |
14 |
efficiency_7 |
this |
last_yr |
all
|
efficiency_7 (6100A, 300V, no filter) |
| 2 |
o | QC1DB |
no |
none |
|
NONE |
none | |
14 |
efficiency_8 |
this |
last_yr |
all
|
efficiency_8 (6500A, 300V, no filter) |
| 3 |
• | QC1DB |
no |
none |
|
NONE |
none | |
18 |
efficiency_9 |
this |
last_yr |
all
|
efficiency_9 (6900A, 300V+GG435) |
| 3 |
◊ | QC1DB |
no |
none |
|
NONE |
none | |
18 |
efficiency_10 |
this |
last_yr |
all
|
efficiency_10 (7300A, 300V+GG435) |
| 3 |
x | QC1DB |
no |
none |
|
NONE |
none | |
18 |
efficiency_11 |
this |
last_yr |
all
|
efficiency_11 (7700A, 300V+GG435) |
| 3 |
o | QC1DB |
no |
none |
|
NONE |
none | |
18 |
efficiency_12 |
this |
last_yr |
all
|
efficiency_12 (8100A, 300V+GG435) |
| 4 |
• | QC1DB |
no |
none |
|
NONE |
none | |
18 |
efficiency_13 |
this |
last_yr |
all
|
efficiency_13 (8500A, 300V+GG435) |
| 4 |
◊ | QC1DB |
no |
none |
|
NONE |
none | |
18 |
efficiency_14 |
this |
last_yr |
all
|
efficiency_14 (8900A, 300V+GG435) |
| |
|
*Data sources: QC1DB: QC1 database; LOCAL: local text file | **OPS: to indicate that OPSLOG data are included
|
General information
Click on any of the plots to see a close-up version.
The latest date is indicated on top of the plot, data points belonging to that date are specially marked.
If configured,
- statistical averages are indicated by a solid line, and thresholds by broken lines
- outliers are marked by a red asterisk. They are defined as data points outside the
threshold lines
- "aliens" (= data points outside the plot Y limits) are marked by a red arrow (↑ or ↓)
- you can download the data for each parameter set if the 'Data downloads' link shows up
|
