mirror sites: PL (internal link) HQ     [?]

Health Check monitor


CAL | HC | refs | QC
HealthCheck Monitor
   HOME | UsersGuide
  sl icon ALL INSTRUMENTS
 
all KPI reports
MIDI:
kappa matrix
Other HC:
QC links:
        [page auto-refreshes after 300 sec]   [stop | on]            [press Ctrl+Shift+R to enforce refresh of scores, dates and news]
MIDI trending system: HEALTH CHECK report
HELP USERS-GUIDE MORE
Last update: 2015-03-06T18:45:41 (UT)
  | now: 2024-03-29T01:12:39 (UT) muc05 QC pipeline: midi-2.8.3 (installed 2014-10-20)
same group: KAPPA_PRISM KAPPA_GRISM KAPPA_longrange
General news: NOTE: The Health Check and calChecker services are moved to qcFlow on an instrument by instrument basis. The current pages will not be updated any longer once the move has been finished.
MIDI news: 2015-03-04: last night of MIDI operations
Report news:
DATE*: [?] 2015-02-27
report | NLT
2015-02-28
report | NLT
2015-03-01
report | NLT
2015-03-02
report | NLT
2015-03-03
report | NLT
2015-03-04
report | NLT
2015-03-05
no data | NLT
P...
Product quality:
products products products products products products no products
     

scores&comments | history ... | plot tutorial ... | contact                 daily/often; important to check     [?]
*Date on this monitor changes at 21:00 UT
Print: Information and research:
- png file - advanced studies: QC1 browser | QC1 plotter
Plot
?
Symb
?
Source
*
Average ? Thresholds ? N_
data
QC1
parameter
Data
downloads
Remarks
method value unit method value
1 QC1DB none   NONE VAL0.6,1.2 8 kappa11_median this | last_yr | all flux in interferometric window 1 from telescope 1
2 QC1DB none   NONE VAL0.6,1.2 8 kappa12_median this | last_yr | all flux in interferometric window 1 from telescope 2
3 QC1DB none   NONE VAL0.6,1.2 8 kappa21_median this | last_yr | all flux in interferometric window 2 from telescope 1
4 QC1DB none   NONE VAL0.6,1.2 8 kappa22_median this | last_yr | all flux in interferometric window 2 from telescope 2
5 QC1DB none   NONE VAL0.00,0.14 8 kappa11_stdev this | last_yr | all  
6 QC1DB none   NONE VAL0.00,0.14 8 kappa12_stdev this | last_yr | all  
7 QC1DB none   NONE VAL0.00,0.14 8 kappa21_stdev this | last_yr | all  
8 QC1DB none   NONE VAL0.00,0.14 8 kappa22_stdev this | last_yr | all  
*Data sources: QC1DB: QC1 database; LOCAL: local data source
Plot 1
scores: 1|
data source:midi_kappamatrix
(QC1 database)
dataset:kappa11_median
average:none
fixed thresholds:0.6...1.2NONE
N_data plotted:8
[click on plot for closeup]
Plot 2
scores: 1|
data source:midi_kappamatrix
(QC1 database)
dataset:kappa12_median
average:none
fixed thresholds:0.6...1.2NONE
N_data plotted:8
[click on plot for closeup]
Plot 3
scores: 1|
data source:midi_kappamatrix
(QC1 database)
dataset:kappa21_median
average:none
fixed thresholds:0.6...1.2NONE
N_data plotted:8
[click on plot for closeup]
Plot 4
scores: 1|
data source:midi_kappamatrix
(QC1 database)
dataset:kappa22_median
average:none
fixed thresholds:0.6...1.2NONE
N_data plotted:8
[click on plot for closeup]
Plot 5
scores: 1|
data source:midi_kappamatrix
(QC1 database)
dataset:kappa11_stdev
average:none
fixed thresholds:0.0...0.14NONE
N_data plotted:8
[click on plot for closeup]
Plot 6
scores: 1|
data source:midi_kappamatrix
(QC1 database)
dataset:kappa12_stdev
average:none
fixed thresholds:0.0...0.14NONE
N_data plotted:8
[click on plot for closeup]
Plot 7
scores: 1|
data source:midi_kappamatrix
(QC1 database)
dataset:kappa21_stdev
average:none
fixed thresholds:0.0...0.14NONE
N_data plotted:8
[click on plot for closeup]
Plot 8
scores: 1|
data source:midi_kappamatrix
(QC1 database)
dataset:kappa22_stdev
average:none
fixed thresholds:0.0...0.14NONE
N_data plotted:8
[click on plot for closeup]
This plot

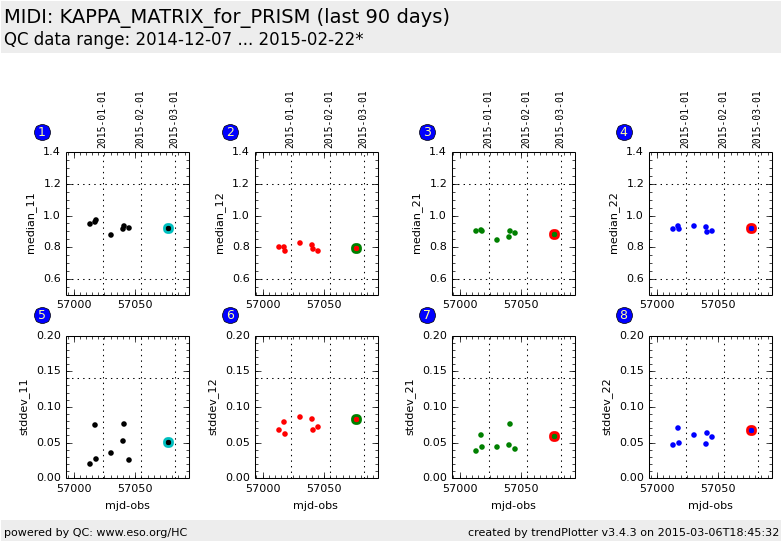
In SCIPHOT mode, we need to define the splitting ratio between the photometric and the interferometric channels. This is given by the cofficients of the Kappa Matrix.
Long gaps could exist between data.  


General information

Click on any of the plots to see a close-up version.

The latest date is indicated on top of the plot.

If configured,

  • data points belonging to the latest date are specially marked
  • statistical averages are indicated by a solid line, and thresholds by broken lines
  • outliers are marked by a red asterisk. They are defined as data points outside the threshold lines
  • "aliens" (= data points outside the plot Y limits) are marked by a red arrow ( or )
  • you can download the data for each parameter set if the 'Data downloads' link shows up