|
|
Health Check monitor |
|
CAL |
HC |
refs |
QC |
||||||||||
HealthCheck Monitor
|
||||||||||
|---|---|---|---|---|---|---|---|---|---|---|
| MIDI: | ||||||||||
| Daily ... | ||||||||||
| Monitoring ... | ||||||||||
| Other HC: | ||||||||||
| UT1 | ||||||||||
| UT2 | ||||||||||
| UT3 | ||||||||||
| UT4 | ||||||||||
| VLTI | ||||||||||
| General monitoring (all historical): | ||||||||||
| qcFlow operational: | ||||||||||
| retired: | ||||||||||
| QC links: | ||||||||||
| [best viewing with style sheets and javascript enabled] | ||||||||||
|
[page auto-refreshes after 300 sec]
[stop
| on]
[press Ctrl+Shift+R to enforce refresh of scores, dates and news]
|
||||||||||||||||||||||||||||||||||||||||||||||||||||||||||||||||||||||||||||
|
||||||||||||||||||||||||||||||||||||||||||||||||||||||||||||||||||||||||||||
|
||||||||||||||||||||||||||||||||||||||||||||||||||||||||||||||||||||||||||||
|
||||||||||||||||||||||||||||||||||||||||||||||||||||||||||||||||||||||||||||
|
||||||||||||||||||||||||||||||||||||||||||||||||||||||||||||||||||||||||||||
|
||||||||||||||||||||||||||||||||||||||||||||||||||||||||||||||||||||||||||||
|
||||||||||||||||||||||||||||||||||||||||||||||||||||||||||||||||||||||||||||

|
||||||||||||||||||||||||||||||||||||||||||||||||||||||||||||||||||||||||||||
|
||||||||||||||||||||||||||||||||||||||||||||||||||||||||||||||||||||||||||||
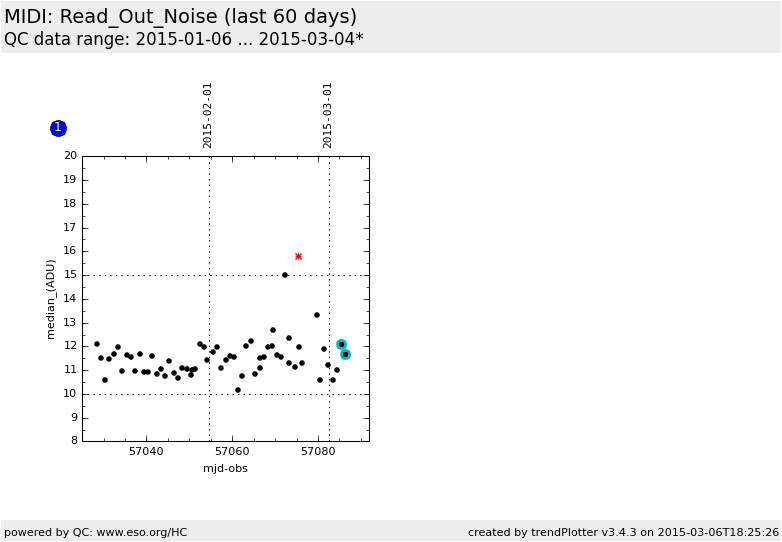
The readout noise of MIDI is monitored by taking a full-frame exposure with a large number of frames, with the MIDI shutter closed and with a minimum DIT. The standard deviation of the pixel level over the frames is computed by the pipeline for each pixel, as well as the median of the standard deviation over all the pixels and all the frames, which is plotted here (expressed in detector ADUs). General information Click on any of the plots to see a close-up version. The latest date is indicated on top of the plot. If configured,
|
||||||||||||||||||||||||||||||||||||||||||||||||||||||||||||||||||||||||||||
