mirror sites: PL (internal link) HQ     [?]

Health Check monitor


CAL | HC | refs | QC
HealthCheck Monitor
   HOME | UsersGuide
  sl icon ALL INSTRUMENTS
 
all KPI reports
MUSE:
detector:bias
Other HC:
QC links:
        [page auto-refreshes after 300 sec]   [stop | on]            [press Ctrl+Shift+R to enforce refresh of scores, dates and news]
MUSE trending system: HEALTH CHECK report
HELP USERS-GUIDE MORE
Last update: 2024-04-19T16:00:41 (UT)
  | now: 2024-04-19T22:13:07 (UT) muc09 QC pipeline: muse-2.8.8 (installed 2023-06-22)
same group: RON_master RON_det BIAS_raw_mean BIAS_raw_median BIAS_median temp
General news: NOTE: The Health Check and calChecker services are moved to qcFlow on an instrument by instrument basis. The current pages will not be updated any longer once the move has been finished.
MUSE news:  
Report news:
DATE*: [?] 2024-04-12
report | NLT
2024-04-13
report | NLT
2024-04-14
no data | NLT
2024-04-15
report | NLT
2024-04-16
report | NLT
2024-04-17
report | NLT
2024-04-18
report | NLT
2024-04-19
no data | NLT
r...
Raw CAL displays:
raw no CAL raw files no CAL raw files raw raw raw raw no CAL raw files
P...
CAL product quality:
products no CAL products no CAL products products products products products no CAL products
 
transfer   ngas [?]

scores&comments | history ... | plot tutorial ... | contact | HC_docu... | quality events...                 daily/often; important to check     [?]
*Date on this monitor changes at 21:00 UT
png: Information and research:
- png file - advanced studies: QC1 browser | QC1 plotter
Plot
?
Symb
?
Source
*
Average ? Thresholds ? N_
data
QC1
parameter
Data
downloads
Remarks
method value unit method value
1 QC1DB MEDIAN 163 K none  84 temp_det5 this | last_yr | all 
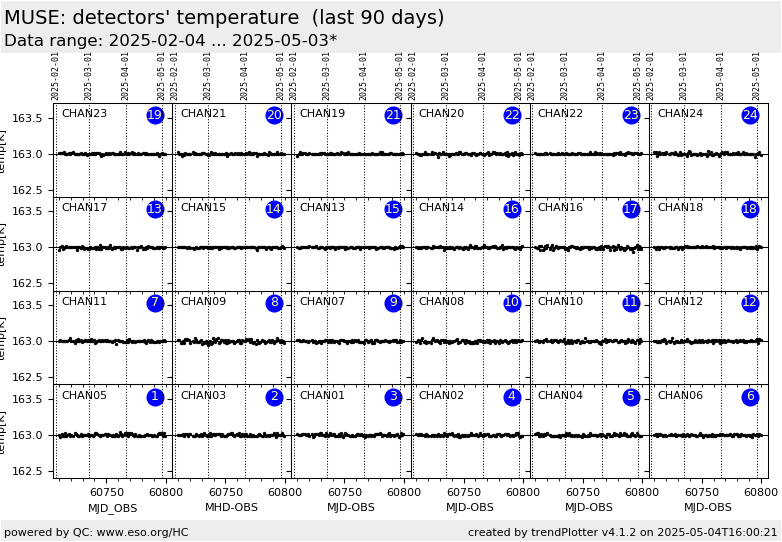
detector temperature [K] for CHAN05
2 QC1DB MEDIAN 163 K none  84 temp_det3 this | last_yr | all detector temperature [K] for CHAN03
3 QC1DB MEDIAN 163 K none  84 temp_det1 this | last_yr | all detector temperature [K] for CHAN01
4 QC1DB MEDIAN 163 K none  84 temp_det2 this | last_yr | all detector temperature [K] for CHAN02
5 QC1DB MEDIAN 163 K none  84 temp_det4 this | last_yr | all detector temperature [K] for CHAN04
6 QC1DB MEDIAN 163 K none  84 temp_det6 this | last_yr | all detector temperature [K] for CHAN06
7 QC1DB MEDIAN 163 K none  84 temp_det11 this | last_yr | all detector temperature [K] for CHAN11
8 QC1DB MEDIAN 163 K none  84 temp_det9 this | last_yr | all detector temperature [K] for CHAN09
9 QC1DB MEDIAN 163 K none  84 temp_det7 this | last_yr | all detector temperature [K] for CHAN07
10 QC1DB MEDIAN 163 K none  84 temp_det8 this | last_yr | all detector temperature [K] for CHAN08
11 QC1DB MEDIAN 163 K none  84 temp_det10 this | last_yr | all detector temperature [K] for CHAN10
12 QC1DB MEDIAN 163 K none  84 temp_det12 this | last_yr | all detector temperature [K] for CHAN12
13 QC1DB MEDIAN 163 K none  84 temp_det17 this | last_yr | all detector temperature [K] for CHAN17
14 QC1DB MEDIAN 163 K none  84 temp_det15 this | last_yr | all detector temperature [K] for CHAN15
15 QC1DB MEDIAN 163 K none  84 temp_det13 this | last_yr | all detector temperature [K] for CHAN13
16 QC1DB MEDIAN 163 K none  84 temp_det14 this | last_yr | all detector temperature [K] for CHAN14
17 QC1DB MEDIAN 163 K none  84 temp_det16 this | last_yr | all detector temperature [K] for CHAN16
18 QC1DB MEDIAN 163 K none  84 temp_det18 this | last_yr | all detector temperature [K] for CHAN18
19 QC1DB MEDIAN 163 K none  84 temp_det23 this | last_yr | all detector temperature [K] for CHAN23
20 QC1DB MEDIAN 163 K none  84 temp_det21 this | last_yr | all detector temperature [K] for CHAN21
21 QC1DB MEDIAN 163 K none  84 temp_det19 this | last_yr | all detector temperature [K] for CHAN19
22 QC1DB MEDIAN 163 K none  84 temp_det20 this | last_yr | all detector temperature [K] for CHAN20
23 QC1DB MEDIAN 163 K none  84 temp_det22 this | last_yr | all detector temperature [K] for CHAN22
24 QC1DB MEDIAN 163 K none  84 temp_det24 this | last_yr | all detector temperature [K] for CHAN24
*Data sources: QC1DB: QC1 database; LOCAL: local data source
Plot 3
scores: not implemented
data source:muse_bias
(QC1 database)
dataset:temp_det1
median:163K
thresholds:none 
N_data plotted:84
[click plot for closeup]
Plot 4
scores: not implemented
data source:muse_bias
(QC1 database)
dataset:temp_det2
median:163K
thresholds:none 
N_data plotted:84
[click plot for closeup]
Plot 2
scores: not implemented
data source:muse_bias
(QC1 database)
dataset:temp_det3
median:163K
thresholds:none 
N_data plotted:84
[click plot for closeup]
Plot 5
scores: not implemented
data source:muse_bias
(QC1 database)
dataset:temp_det4
median:163K
thresholds:none 
N_data plotted:84
[click plot for closeup]
Plot 1
scores: not implemented
data source:muse_bias
(QC1 database)
dataset:temp_det5
median:163K
thresholds:none 
N_data plotted:84
[click plot for closeup]
Plot 6
scores: not implemented
data source:muse_bias
(QC1 database)
dataset:temp_det6
median:163K
thresholds:none 
N_data plotted:84
[click plot for closeup]
Plot 9
scores: not implemented
data source:muse_bias
(QC1 database)
dataset:temp_det7
median:163K
thresholds:none 
N_data plotted:84
[click plot for closeup]
Plot 10
scores: not implemented
data source:muse_bias
(QC1 database)
dataset:temp_det8
median:163K
thresholds:none 
N_data plotted:84
[click plot for closeup]
Plot 8
scores: not implemented
data source:muse_bias
(QC1 database)
dataset:temp_det9
median:163K
thresholds:none 
N_data plotted:84
[click plot for closeup]
Plot 11
scores: not implemented
data source:muse_bias
(QC1 database)
dataset:temp_det10
median:163K
thresholds:none 
N_data plotted:84
[click plot for closeup]
Plot 7
scores: not implemented
data source:muse_bias
(QC1 database)
dataset:temp_det11
median:163K
thresholds:none 
N_data plotted:84
[click plot for closeup]
Plot 12
scores: not implemented
data source:muse_bias
(QC1 database)
dataset:temp_det12
median:163K
thresholds:none 
N_data plotted:84
[click plot for closeup]
Plot 15
scores: not implemented
data source:muse_bias
(QC1 database)
dataset:temp_det13
median:163K
thresholds:none 
N_data plotted:84
[click plot for closeup]
Plot 16
scores: not implemented
data source:muse_bias
(QC1 database)
dataset:temp_det14
median:163K
thresholds:none 
N_data plotted:84
[click plot for closeup]
Plot 14
scores: not implemented
data source:muse_bias
(QC1 database)
dataset:temp_det15
median:163K
thresholds:none 
N_data plotted:84
[click plot for closeup]
Plot 17
scores: not implemented
data source:muse_bias
(QC1 database)
dataset:temp_det16
median:163K
thresholds:none 
N_data plotted:84
[click plot for closeup]
Plot 13
scores: not implemented
data source:muse_bias
(QC1 database)
dataset:temp_det17
median:163K
thresholds:none 
N_data plotted:84
[click plot for closeup]
Plot 18
scores: not implemented
data source:muse_bias
(QC1 database)
dataset:temp_det18
median:163K
thresholds:none 
N_data plotted:84
[click plot for closeup]
Plot 21
scores: not implemented
data source:muse_bias
(QC1 database)
dataset:temp_det19
median:163K
thresholds:none 
N_data plotted:84
[click plot for closeup]
Plot 22
scores: not implemented
data source:muse_bias
(QC1 database)
dataset:temp_det20
median:163K
thresholds:none 
N_data plotted:84
[click plot for closeup]
Plot 20
scores: not implemented
data source:muse_bias
(QC1 database)
dataset:temp_det21
median:163K
thresholds:none 
N_data plotted:84
[click plot for closeup]
Plot 23
scores: not implemented
data source:muse_bias
(QC1 database)
dataset:temp_det22
median:163K
thresholds:none 
N_data plotted:84
[click plot for closeup]
Plot 19
scores: not implemented
data source:muse_bias
(QC1 database)
dataset:temp_det23
median:163K
thresholds:none 
N_data plotted:84
[click plot for closeup]
Plot 24
scores: not implemented
data source:muse_bias
(QC1 database)
dataset:temp_det24
median:163K
thresholds:none 
N_data plotted:84
[click plot for closeup]
This plot

This is MUSE BIAS_temp health check plot showing temperatures [K] of the individual detectors. The values are extracted from the master BIAS calibrations. The layout of the panels corresponds to the real arrangement of the MUSE channels.

The BIAS calibration data are taken with template TPL.ID=MUSE_cal_bias

 
General information

Click on any of the plots to see a close-up version.

The latest date is indicated on top of the plot.

If configured,

  • data points belonging to the latest date are specially marked
  • statistical averages are indicated by a solid line, and thresholds by broken lines
  • outliers are marked by a red asterisk. They are defined as data points outside the threshold lines
  • "aliens" (= data points outside the plot Y limits) are marked by a red arrow ( or )
  • you can download the data for each parameter set if the 'Data downloads' link shows up