Plot
? |
Symb
? |
Source
* |
Average ? |
Thresholds ? |
N_
data |
QC1
parameter |
Data
downloads |
Remarks |
| method |
value |
unit |
method |
value |
| 1 |
• | QC1DB |
MEDIAN |
19.7 |
counts/sec |
VAL | 15.8,21.8 |
194 |
int_avg |
this |
last_yr |
all
|
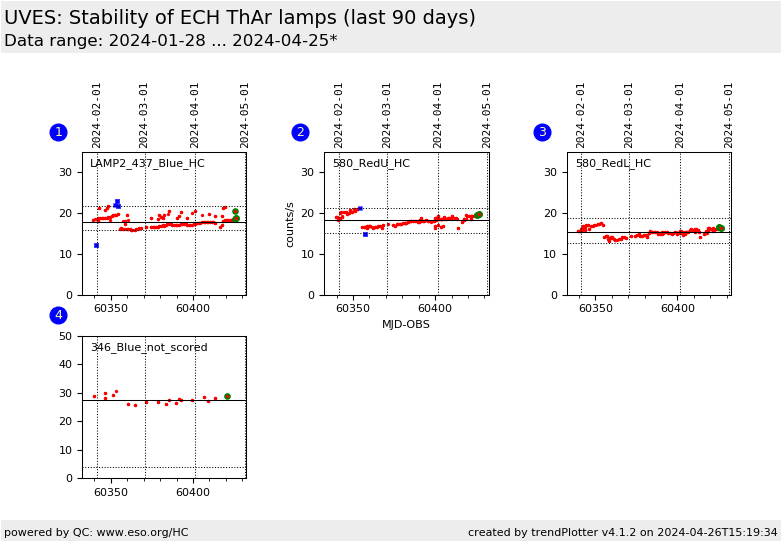
Stability of ThAr lamp from BLUE 437nm, 1x1, 0.4arcs data |
| 2 |
• | QC1DB |
MEDIAN |
20.8 |
counts/sec |
VAL | 15.26,21.26 |
217 |
int_avg |
this |
last_yr |
all
|
Stability of ThAr lamp from REDU 580nm, 1x1, 0.3arcs data |
| 3 |
• | QC1DB |
MEDIAN |
17.6 |
counts/sec |
VAL | 12.77,18.77 |
225 |
int_avg |
this |
last_yr |
all
|
Stability of ThAr lamp from REDL 580nm, 1x1, 0.3arcs data |
| 4 |
• | QC1DB |
MEDIAN |
30.8 |
counts/sec |
VAL | 4,80 |
26 |
int_avg |
this |
last_yr |
all
|
Stability of ThAr lamp from BLUE 346nm, 1x1, 1.0arcs data. This is not scored |
| |
|
*Data sources: QC1DB: QC1 database; LOCAL: local data source
|
Plot 1
scores:  8| 8|
| | data source: | uves_wave
(QC1 database) |
| dataset: | int_avg | • |
| median: | 19.7 | counts/sec |
| fixed thresholds: | 15.8...21.8 | counts/sec |
| N_data plotted: | 194 |
| [click plot for closeup] |
Plot 2
scores:  8| 8|
| | data source: | uves_wave
(QC1 database) |
| dataset: | int_avg | • |
| median: | 20.8 | counts/sec |
| fixed thresholds: | 15.26...21.26 | counts/sec |
| N_data plotted: | 217 |
| [click plot for closeup] |
Plot 3
scores: 8|
| | data source: | uves_wave
(QC1 database) |
| dataset: | int_avg | • |
| median: | 17.6 | counts/sec |
| fixed thresholds: | 12.77...18.77 | counts/sec |
| N_data plotted: | 225 |
| [click plot for closeup] |
Plot 4
scores: not implemented
| | data source: | uves_wave
(QC1 database) |
| dataset: | int_avg | • |
| median: | 30.8 | counts/sec |
| fixed thresholds: | 4...80 | counts/sec |
| N_data plotted: | 26 |
| [click plot for closeup] |
This is the trending report for the UVES ThAr lamp (LAMP2).
It monitors the average intensity of the emission lines, normalized by
EXPTIME.
It is based on daily Health check data 437nm, 0.4arcs slit, and 580nm, 0.3
arcs slit.
These plots describe:
- the average emission line intensity int_avg for LAMP 2, the ThAr lamp,
measured in the BLUE (437nm)
- the same as measured on the REDU CCD (580nm),
- the same as measured on the REDL CCD (580nm).
Find more information about UVES Echelle WAVE frames here.
General information
Click on any of the plots to see a close-up version.
The latest date is indicated on top of the plot.
If configured,
- data points belonging to the latest date are specially marked
- statistical averages are indicated by a solid line, and thresholds by broken lines
- outliers are marked by a red asterisk. They are defined as data points outside the
threshold lines
- "aliens" (= data points outside the plot Y limits) are marked by a red arrow (↑ or ↓)
- you can download the data for each parameter set if the 'Data downloads' link shows up
|
