Plot
? |
Symb
? |
Source
* |
Average ? |
Thresholds ? |
N_
data |
QC1
parameter |
Data
downloads |
Remarks |
| method |
value |
unit |
method |
value |
| 1 |
• | QC1DB |
MEDIAN |
4.82 |
none |
none | |
88 |
resid_rms |
this |
last_yr |
all
|
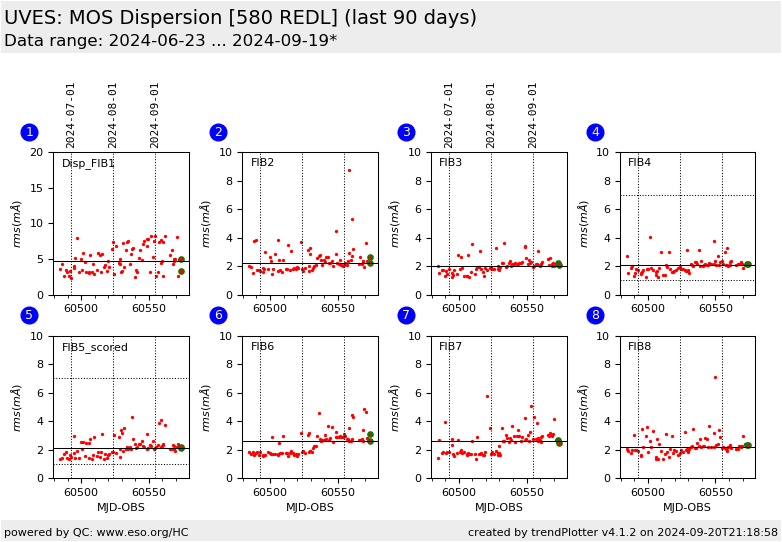
Dispersion of wavelength solution, from MOS WAVE data, 580.0nm, 1x1, Plate 1, 7+1FIB Mode, Fibre 1, RED LOWER CCD |
| 2 |
• | QC1DB |
MEDIAN |
2.27 |
none |
none | |
88 |
resid_rms |
this |
last_yr |
all
|
same, for fibre 2 |
| 3 |
• | QC1DB |
MEDIAN |
2.05 |
none |
none | |
88 |
resid_rms |
this |
last_yr |
all
|
same, for fibre 3 |
| 4 |
• | QC1DB |
MEDIAN |
2.07 |
none |
VAL | 1.0,7.0 |
88 |
resid_rms |
this |
last_yr |
all
|
same, for fibre 4; this plot is not scored. |
|
| 5 |
• | QC1DB |
MEDIAN |
2.17 |
none |
VAL | 1.0,7.0 |
88 |
resid_rms |
this |
last_yr |
all
|
same, for fibre 5; this plot is scored. |
| 6 |
• | QC1DB |
MEDIAN |
2.65 |
none |
none | |
88 |
resid_rms |
this |
last_yr |
all
|
same, for fibre 6 |
| 7 |
• | QC1DB |
MEDIAN |
2.64 |
none |
none | |
88 |
resid_rms |
this |
last_yr |
all
|
same, for fibre 7 |
| 8 |
• | QC1DB |
MEDIAN |
2.21 |
none |
none | |
88 |
resid_rms |
this |
last_yr |
all
|
same, for fibre 8 |
| |
|
*Data sources: QC1DB: QC1 database; LOCAL: local data source
|
Plot 1
scores: not implemented
| | data source: | uves_fib_wave
(QC1 database) |
| dataset: | resid_rms | • |
| median: | 4.82 | none |
| thresholds: | none | |
| N_data plotted: | 88 |
| [click plot for closeup] |
Plot 2
scores: not implemented
| | data source: | uves_fib_wave
(QC1 database) |
| dataset: | resid_rms | • |
| median: | 2.27 | none |
| thresholds: | none | |
| N_data plotted: | 88 |
| [click plot for closeup] |
Plot 3
scores: not implemented
| | data source: | uves_fib_wave
(QC1 database) |
| dataset: | resid_rms | • |
| median: | 2.05 | none |
| thresholds: | none | |
| N_data plotted: | 88 |
| [click plot for closeup] |
Plot 4
scores: not implemented
| | data source: | uves_fib_wave_scoreQC
(QC1 database) |
| dataset: | resid_rms | • |
| median: | 2.07 | none |
| fixed thresholds: | 1.0...7.0 | none |
| N_data plotted: | 88 |
| [click plot for closeup] |
Plot 5
scores:  9| 9|

| | data source: | uves_fib_wave_fib5
(QC1 database) |
| dataset: | resid_rms | • |
| median: | 2.17 | none |
| fixed thresholds: | 1.0...7.0 | none |
| N_data plotted: | 88 |
| [click plot for closeup] |
Plot 6
scores: not implemented
| | data source: | uves_fib_wave
(QC1 database) |
| dataset: | resid_rms | • |
| median: | 2.65 | none |
| thresholds: | none | |
| N_data plotted: | 88 |
| [click plot for closeup] |
Plot 7
scores: not implemented
| | data source: | uves_fib_wave
(QC1 database) |
| dataset: | resid_rms | • |
| median: | 2.64 | none |
| thresholds: | none | |
| N_data plotted: | 88 |
| [click plot for closeup] |
Plot 8
scores: not implemented
| | data source: | uves_fib_wave
(QC1 database) |
| dataset: | resid_rms | • |
| median: | 2.21 | none |
| thresholds: | none | |
| N_data plotted: | 88 |
| [click plot for closeup] |
This is the trending report for FLAMES/UVES QC parameters derived for
wavelength calibration. It covers the rms of the dispersion solution and is based on MOS data taken with
the RED LOWER CCD in
setting 580nm, 7+1FIB, with Plate 1.
Please note that the pipeline is rather poor in determining the resid_rms for the
REDL CCD, the scatter is quite large.
The HC plot for the
RED UPPER CCD has better accuracy.
General information
Click on any of the plots to see a close-up version.
The latest date is indicated on top of the plot.
If configured,
- data points belonging to the latest date are specially marked
- statistical averages are indicated by a solid line, and thresholds by broken lines
- outliers are marked by a red asterisk. They are defined as data points outside the
threshold lines
- "aliens" (= data points outside the plot Y limits) are marked by a red arrow (↑ or ↓)
- you can download the data for each parameter set if the 'Data downloads' link shows up
|
