Plot
? |
Symb
? |
Source
* |
Average ? |
Thresholds ? |
N_
data |
QC1
parameter |
Data
downloads |
Remarks |
| method |
value |
unit |
method |
value |
| 1 |
• | QC1DB |
MEDIAN |
55.8 |
ADU |
none | |
38 |
qc_mean_sky |
this |
last_yr |
all
|
upper chip flux ratio in Ks |
| 2 |
• | QC1DB |
MEDIAN |
16.3 |
ADU |
none | |
39 |
qc_mean_sky |
this |
last_yr |
all
|
upper chip flux ratio in J |
| 3 |
• | QC1DB |
MEDIAN |
2.24 |
ADU |
none | |
40 |
qc_mean_sky |
this |
last_yr |
all
|
upper chip flux ratio in Z |
| 4 |
• | QC1DB |
MEDIAN |
84.4 |
ADU |
none | |
39 |
qc_mean_sky |
this |
last_yr |
all
|
upper chip flux ratio in H |
| 5 |
• | QC1DB |
MEDIAN |
5.79 |
ADU |
none | |
39 |
qc_mean_sky |
this |
last_yr |
all
|
upper chip flux ratio in Y |
| 6 |
• | QC1DB |
MEDIAN |
51.6 |
ADU |
none | |
3 |
qc_mean_sky |
this |
last_yr |
all
|
upper chip flux ratio in NB118 |
| |
|
*Data sources: QC1DB: QC1 database; LOCAL: local data source
|
Plot 1
scores: not implemented
| | data source: | vircam_photstd
(QC1 database) |
| dataset: | qc_mean_sky | • |
| median: | 55.8 | ADU |
| thresholds: | none | |
| N_data plotted: | 38 |
| [click plot for closeup] |
Plot 2
scores: not implemented
| | data source: | vircam_photstd
(QC1 database) |
| dataset: | qc_mean_sky | • |
| median: | 16.3 | ADU |
| thresholds: | none | |
| N_data plotted: | 39 |
| [click plot for closeup] |
Plot 3
scores: not implemented
| | data source: | vircam_photstd
(QC1 database) |
| dataset: | qc_mean_sky | • |
| median: | 2.24 | ADU |
| thresholds: | none | |
| N_data plotted: | 40 |
| [click plot for closeup] |
Plot 4
scores: not implemented
| | data source: | vircam_photstd
(QC1 database) |
| dataset: | qc_mean_sky | • |
| median: | 84.4 | ADU |
| thresholds: | none | |
| N_data plotted: | 39 |
| [click plot for closeup] |
Plot 5
scores: not implemented
| | data source: | vircam_photstd
(QC1 database) |
| dataset: | qc_mean_sky | • |
| median: | 5.79 | ADU |
| thresholds: | none | |
| N_data plotted: | 39 |
| [click plot for closeup] |
Plot 6
scores: not implemented
| | data source: | vircam_photstd
(QC1 database) |
| dataset: | qc_mean_sky | • |
| median: | 51.6 | ADU |
| thresholds: | none | |
| N_data plotted: | 3 |
| [click plot for closeup] |
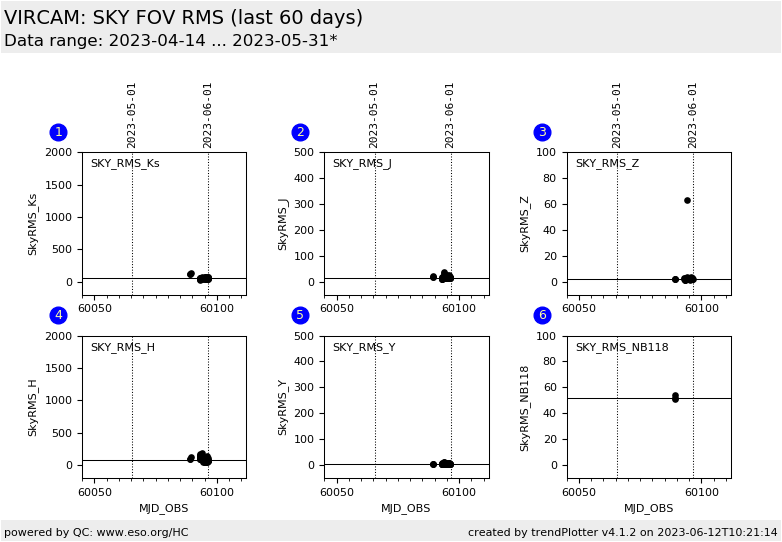
Trending plot for SKY_RMS, the RMS over all 16 mean sky values.
QC parameters is derived from photometric standard star calibrations.
Name:
Fits header: QC.MEAN_SKY,
QC1 DB: qc_mean_sky
Description:
The mean sky of the daily photometric standard star observations is taken; per detector.
The RMS from the sample of 16 detectors is taken as a measure for background variations over the VISTA FOV.
Setup:
INS.FILT1.NAME = Ks, J, H, Y, Z, and NB118
Find more information on the VIRCAM STANDARD STAR tutorial page.
General information
Click on any of the plots to see a close-up version.
The latest date is indicated on top of the plot.
If configured,
- data points belonging to the latest date are specially marked
- statistical averages are indicated by a solid line, and thresholds by broken lines
- outliers are marked by a red asterisk. They are defined as data points outside the
threshold lines
- "aliens" (= data points outside the plot Y limits) are marked by a red arrow (↑ or ↓)
- you can download the data for each parameter set if the 'Data downloads' link shows up
|
